

✨ Originality and Utility
Most regression-channel tools on the platform work from a single static bar count chosen by the user, redraw the entire channel on every bar, and offer no way to judge whether the underlying price action is actually behaving linearly enough for a straight-line model to be meaningful. This script addresses all three limitations at once. It measures channel validity using the Pearson correlation coefficient rather than assuming a regression fit is automatically useful, it restarts its lookback window dynamically at the most recent statistically valid swing pivot rather than a fixed period, and it finalizes historical segments as discrete drawn objects instead of continuously repainting a single line across the whole chart.
● Why These Components Are Combined
The regression engine, the pivot-anchoring logic, the adaptive source filter, the ADX gate, and the merge engine are not stacked together arbitrarily; each solves a specific weakness left open by the others. The adaptive smoothing stage reduces the high-frequency noise that a raw-price regression is otherwise highly sensitive to. The pivot-anchoring logic solves the “where should this channel actually start” problem that fixed-length regression channels never address. The Pearson fit-quality filter prevents the tool from drawing a confident-looking straight line through what is statistically a sideways, non-linear market. The ADX filter exists specifically to reduce breakout signals firing inside genuinely trendless conditions. The merge engine exists to prevent the chart from filling with redundant, near-identical channel segments once the pivot-anchoring logic starts producing frequent restarts on lower timeframes. Together, these form one coherent statistically-aware channel system rather than five unrelated features bundled for the sake of it.
🔬 Methodology and Concepts
● Regression Engine
At its core, the script performs an ordinary least-squares linear regression across the bars since the current channel’s anchor point, producing a slope and intercept that define the channel’s midline. This calculation always runs on confirmed, closed price data, never on the live forming bar.
● Statistical Validity Filter
Every regression is scored with the Pearson correlation coefficient, which measures how well price actually fits a straight line on a scale of -1 to 1. A minimum bar count and a minimum absolute correlation strength (both user-configurable) must be met before a channel, or a breakout signal derived from it, is considered valid. Channels that fail this test are still drawn, but are visually flagged as low-confidence rather than treated as a directional signal.
● Deviation Bands
Upper and lower channel boundaries are placed a user-defined number of standard deviations away from the regression midline, based on the vertical dispersion of price around that line. This produces a statistically scaled envelope rather than a fixed-percentage or fixed-tick band.
● Adaptive Source Filter
Instead of regressing on raw closing price, the script can first pass price through one of several smoothing methods, selectable per chart:
- SMA / EMA / RMA — standard simple, exponential, and Wilder-smoothed moving averages, offered as baseline options with different responsiveness-to-noise tradeoffs.
- Double WMA — a weighted moving average smoothed a second time through another weighted pass, trading additional lag for a cleaner underlying line.
- Triple VWMA — a volume-weighted moving average smoothed through three successive passes, intended for instruments where volume-weighting the trend estimate is meaningful.
- HMA — a low-lag moving average designed to track price more closely than a standard average of the same length.
- LLAMA — a proprietary MarkitTick method that blends a simple average baseline with a linear slope term measured across the filter length, effectively projecting the recent directional momentum forward onto the smoothing output rather than only averaging past values.
- Kalman Filter — a recursive single-state estimator that continuously balances its own prediction against each new price print, with the filter length controlling how much weight is given to new information versus the existing estimate.
Selecting “None” regresses directly on the previous confirmed close.
● Dynamic Pivot Anchoring
The script tracks confirmed swing highs and swing lows using a symmetric bar-confirmation window (either auto-scaled to the chart’s timeframe or manually set). These pivots are only accepted once enough bars have closed on both sides of the candidate bar to confirm it, so no pivot is ever assumed before it is actually confirmable. When a breakout occurs, the script evaluates whether the most recent opposite-type pivot has a strong enough regression fit of its own to serve as a more representative channel origin; if it does, the newly drawn segment is anchored there instead of at the current bar.
● Confirmation Lag Notice
Because segment anchors are only finalized once a breakout confirms them, a newly drawn historical segment’s starting point is placed at a bar in the past, after the fact. This is standard behavior for any pivot-anchored channel tool and does not involve unconfirmed or future data, but it does mean the visual origin of a finalized segment was not known in real time at that bar; it becomes fixed only once the breakout that closes out the prior segment occurs.
● Channel Merge Logic
When enabled, a newly forming channel is compared against the band edges of the segment it is replacing. If the gap between them falls within a user-selected tolerance (expressed as a multiple of the current standard deviation), no new discrete segment is drawn and the channel is treated as a continuation. This keeps visually similar, closely-spaced channels from cluttering the chart as separate labeled objects.
● ADX Trend Filter
An optional Average Directional Index filter can require a minimum trend strength reading before a breakout is allowed to register as a directional signal, reducing the number of signals generated while the market is directionless.
● Breakout Signal Logic and Webhook Alerts
A directional signal fires only on a confirmed bar, only when the minimum bar count and fit-quality thresholds are met, and only once per new breakout (not on every bar the price remains beyond the band). Each signal type — long entry, short entry, and their corresponding opposite-side close — has its own configurable action label, which is packaged into a JSON payload suitable for forwarding to third-party automation or webhook services.
🎨 Visual Guide
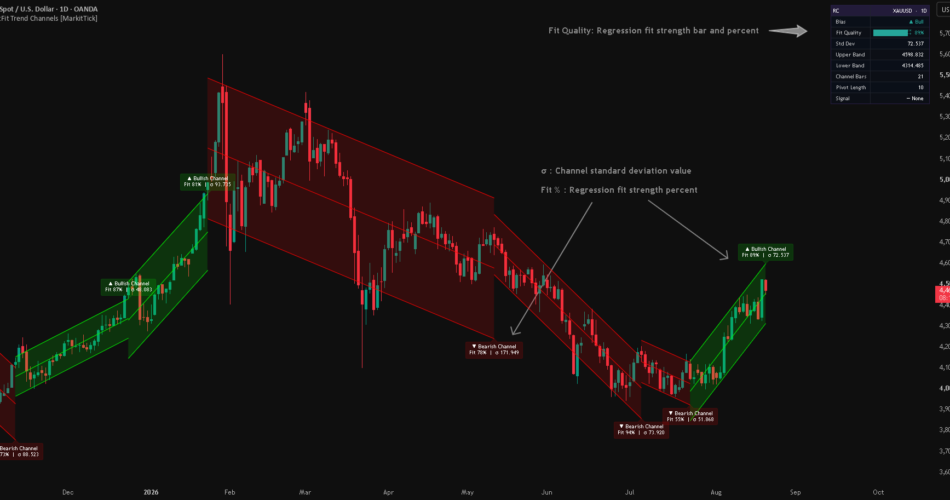
The live, currently forming channel is drawn as three connected lines — an upper band, a midline, and a lower band — with the space between the bands filled in a translucent color. Green indicates a bullish-sloped channel, red indicates a bearish-sloped channel, and gray indicates a channel that has not met the minimum fit-quality threshold and should be treated as statistically unreliable. A small label at the live edge of the channel states its bias, its fit percentage (the Pearson correlation expressed as a percentage), and its standard deviation value. When a segment finalizes, its own colored line-and-fill combination plus a labeled marker remain on the chart as a permanent historical record of that channel. An optional setting recolors the chart’s candles using the live channel’s bias color for an at-a-glance read of current conditions without needing to look at the channel itself. In the corner of the chart (position configurable), a compact dashboard table lists the ticker and timeframe, current bias, a bar-style fit-quality gauge, the standard deviation value, the current upper and lower band prices, the number of bars in the active channel, the pivot length in use, the current breakout/breakdown state, and — only when the relevant filters are enabled — the live ADX reading and the selected adaptive filter type.
📖 How to Use
Read channel color and the dashboard’s Bias row together: a green, high-fit-percentage channel reflects a statistically supported uptrend in the regression sense, while red reflects the equivalent downtrend condition. Treat gray, low-fit-percentage channels as periods where price is not moving in a way a straight line meaningfully describes, and weight any signal generated during those conditions accordingly. A directional signal, visible as a Breakout or Breakdown state on the dashboard and paired with an alert firing, indicates confirmed price has closed beyond the channel’s statistical deviation band with sufficient trend history and fit quality behind it — this is a signal generator, not a backtested strategy, so no historical win-rate or equity curve is produced by the script itself. Enabling the ADX filter is most useful on instruments or timeframes prone to frequent whipsaw, where it will suppress breakouts that occur without adequate underlying trend strength. Choosing a smoother adaptive filter (Double WMA, Triple VWMA) will produce fewer but later channel restarts; choosing a more responsive one (HMA, Kalman, LLAMA) will track price more closely at the cost of more frequent re-anchoring. Enable channel merging on lower timeframes or choppier symbols to keep the chart readable; disable it if you want to see every discrete regression segment the script produces. To receive the webhook-ready alerts, create an alert on the script using the “Any alert() function call” option, or select one of the four named alert conditions individually if only a subset of signals is needed.
⚙️ Inputs and Settings
The Core group controls the statistical backbone of the tool: automatic or manual pivot lookback length, whether nearby channels merge and how strict that merge tolerance is, the minimum Pearson fit strength and minimum bar count required for a channel to be considered valid, and the deviation z-score used to size the bands. The Filters group holds the optional ADX trend gate (toggle, threshold, and length) and the adaptive source filter selection along with its length. The Visuals group controls channel line width and whether chart candles are recolored by the live channel bias. The Dashboard group sets which corner of the chart the statistics table is drawn in. The Alerts group defines the text sent in the “action” field of each of the four webhook JSON payloads (long, short, close-long, close-short), allowing the payload vocabulary to be matched to whatever automation platform is receiving it. The Colors group governs the bullish, bearish, and weak-fit channel colors, the support/resistance accent colors used in the dashboard gauge, and the dashboard’s background, header, text, and warning colors.
🔍 Deconstruction of the Underlying Scientific and Academic Framework
The regression core is an ordinary least-squares fit — the same slope and intercept formulas taught in introductory statistics, chosen because they minimize the sum of squared vertical distances between the line and each price point in the window. Layered on top of this is the Pearson product-moment correlation coefficient, the standard statistical measure of how strongly two variables are linearly related; applying it to price-versus-time is the same logic underlying R²-based confidence filters used in quantitative trend-following research, here repurposed as a simple accept/reject gate for whether a channel is worth trusting. The deviation bands draw on the same statistical foundation as Bollinger-style envelopes — a mean or trend estimate flanked by a multiple of the underlying standard deviation — except the dispersion here is measured as residual distance from a sloped regression line rather than from a flat moving average, and a z-score of 1.96 specifically corresponds to the approximate 95% interval of a normal distribution, a deliberate nod to standard statistical confidence-interval convention. The pivot-confirmation logic is a symmetric-window fractal test in the tradition of classic swing-high/swing-low detection methods, used here purely as a principled way to choose a channel’s starting point rather than as a standalone trading signal. The ADX/DMI component follows Welles Wilder’s original directional movement framework for measuring trend strength independent of trend direction. Among the adaptive filters, the Kalman option applies a simplified single-state predict-correct estimator common in signal processing and control theory, while the LLAMA option applies a linear-extrapolation-style adjustment to a moving average — conceptually related to trend-adjusted smoothing methods such as Holt’s linear exponential smoothing, which projects recent momentum forward rather than only averaging past observations.
⚠️ Disclaimer
All provided scripts and indicators are strictly for educational exploration and must not be interpreted as financial advice or a recommendation to execute trades. We expressly disclaim all liability for any financial losses or damages that may result, directly or indirectly, from the reliance on or application of these tools. Market participation carries inherent risk where past performance never guarantees future returns, leaving all investment decisions and due diligence solely at your own discretion.
Source link
Author

- Ytv Market News
- Share-market news writer and analyst with deep experience covering equities, commodities, forex, and cryptocurrencies for readers in the USA, UK, Canada, and Australia. Ytv Market News delivers timely market updates, practical trading insights, and clear explanations of macro and company-level catalysts that move prices. Combines on-the-ground financial reporting with technical analysis, using concise charts and actionable ideas to help investors and traders make smarter decisions.
Latest entries
 Investing InsightsAugust 24, 2026Hong Kong Banks Begin Verification of Dormant Mainland Investor Accounts; Over 20% of Accounts May Face Investment Function Suspension
 GermanyAugust 24, 2026Norway will drill in Arctic regardless of EU’s position, says energy minister
 Crypto NewsAugust 24, 2026Bitcoin Meets Banking As Saylor Pushes A Sovereignty Vision
 Crypto NewsAugust 24, 2026Ripple Price Prediction: XRP pulls back despite strong ETF inflows


