

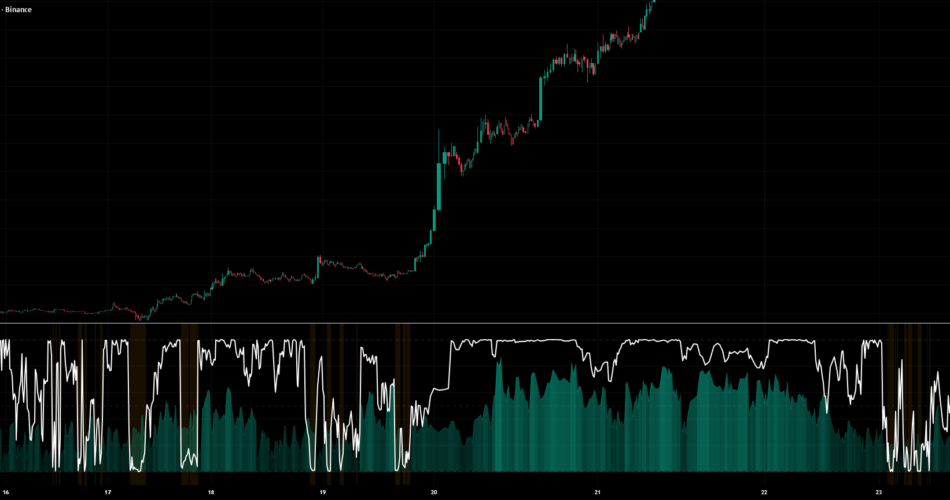
WHAT IT COMPUTES
Inside each of four timeframes (15m, 1H, 4H, 1D by default) it detrends price against a weighted moving average and runs a causal six-tap Ehlers-style FIR quadrature pair on the result. That gives an in-phase and a quadrature component, and from them an instantaneous phase and amplitude for that timeframe, computed on that timeframe’s own bars rather than resampled from the chart.
Each timeframe’s phase is trusted only while its quadrature amplitude is alive: the gate is the amplitude divided by its own 20-bar EMA, capped at 1. The four gated phase vectors are combined with the attention weights into a weighted circular mean. The white line is 50 + 50·cos of that mean phase. The teal area is the phase-locking value: the length of the resultant vector, renormalised by the active weight, on a 0 to 100 scale.
WHAT THE MEASUREMENT FOUND
Real data produces LESS phase clustering than deliberately misaligned data.
On BINANCE:BTCUSDT 15m over 5,836 scored bars (2026-06-22 to 2026-08-22), the mean phase-lock value is 36.76. Against a null that circularly shifts each timeframe’s phase series relative to the others – destroying any alignment between them while preserving each series’ own distribution – the null’s median is 40.12, and the real series sits below it with p = 0.010 over 200 draws. A second 200-draw seed gives 36.53 against 40.37 at p = 0.005, and at 1,000 draws the same direction holds at p = 0.005 in all four instrument-and-timeframe cells tested.
The mechanism is the interesting part. Two of the three adjacent pairs do carry a real relationship: 15m to 1H has a circular coupling of R = 0.115 at an offset of -176 degrees, and 1H to 4H has R = 0.136 at +155 degrees. Both are close to anti-phase. The third pair, 4H to 1D, shows nothing (R = 0.123 against a shift null at p = 0.189). A resultant-length statistic like the phase-lock value adds vectors together, so a pair sitting near 180 degrees apart cancels rather than accumulates. The structure that exists in this data is precisely the structure this statistic is built to erase. The coupling is weak in any case – roughly 1.5% of circular variance – so this is a description of a small effect, not a discovery.
The threshold reflects the same thing. The 70 line is crossed 70 times on real data against a null median of 117 crossings. The trough quadrant is not informative either: it is occupied on 22.65% of bars at the default 45-degree half-width, and the shift null reproduces almost the same figure, 23.13%, at p = 0.612.
There is no edge here. A nominally significant one-day return after a 70 crossing (+0.974%, p = 0.0199) fails on both of the checks that matter: on ETHUSDT over the identical window it gives p = 0.270, and on BTCUSDT 68% of the effect comes from a single calendar day, after whose removal the mean is 0.338% against an unconditional drift of 0.328% over the same window.
WHAT THE SCALE MEANS
The phase-lock value can reach 100, but not often: it is bounded by 100 times the weighted mean gate, which averages 0.766, so a typical bar tops out near 77 even with four identical phases. All four gates saturate at 1 on 2.7% of bars. Decomposed multiplicatively, the coherence term does most of the work: of the variance in the log of the phase-lock value, 88% comes from the resultant length and 12% from the gate.
WHAT CHANGED IN THIS VERSION
The two trough markers are gone. A green up-triangle at the bottom of the pane and a red down-triangle at the top are the universal grammar of buy and sell, and the measurement points the other way: the mean one-day return starting inside the trough quadrant was +0.226% against +0.687% inside the peak quadrant. The state remains as neutral background shading, retitled to say what it is – the mean phase near the minimum of its cosine – and the two alerts built on it are gone. The one remaining alert simply reports the threshold crossing and says in its own message that this is a reading of the statistic rather than a claim of synchronisation.
A phase audit table promised by the settings and by five helper functions did not exist anywhere in the file; the promise was deleted rather than the table built. Four of the six series returned from each timeframe sensor – the raw in-phase and quadrature components, the amplitude and the phase change – were never read by anything, across all eight higher-timeframe calls, and are gone. Three lead/lag series were computed and never rendered, and are gone too. An MPL header was added and a leftover compile-sentinel plot removed. None of that touches a plotted number.
One thing worth knowing before turning knobs: at the default Detrended price signal, the Stochastic length, RSI length, StochRSI length and K smoothing inputs are completely inert – every value produces a bit-identical output. They only matter if the quadrature input signal is changed.
HOW THE NUMBERS WERE CHECKED
The whole computation was reimplemented outside Pine and cross-checked against this chart’s Data Window: eight quantities on ten bars, with the per-timeframe phase waves switched on so nothing was left as na. All 80 values round to the exact four decimals TradingView prints, with a worst raw difference of 5.0e-5 – the display’s own rounding floor.
Open source under MPL 2.0. Nothing here is a forecast, a signal service, or a claim of profitability.
Source link
Author

- Ytv Market News
- Share-market news writer and analyst with deep experience covering equities, commodities, forex, and cryptocurrencies for readers in the USA, UK, Canada, and Australia. Ytv Market News delivers timely market updates, practical trading insights, and clear explanations of macro and company-level catalysts that move prices. Combines on-the-ground financial reporting with technical analysis, using concise charts and actionable ideas to help investors and traders make smarter decisions.
Latest entries
 Trading IndicatorsAugust 24, 2026RSI Zone Step Lines — Indicator by Devjames — TradingView
 UsaAugust 24, 2026A Lumentum Executive Sold 2,000 Shares Under a Plan He Filed in May. Here’s What to Know
 AustraliaAugust 24, 2026By August 2027, $5,000 invested in Ampol shares could turn into…
 Crypto NewsAugust 24, 2026Bernstein keeps $140 Circle target even if CLARITY Act fails


