

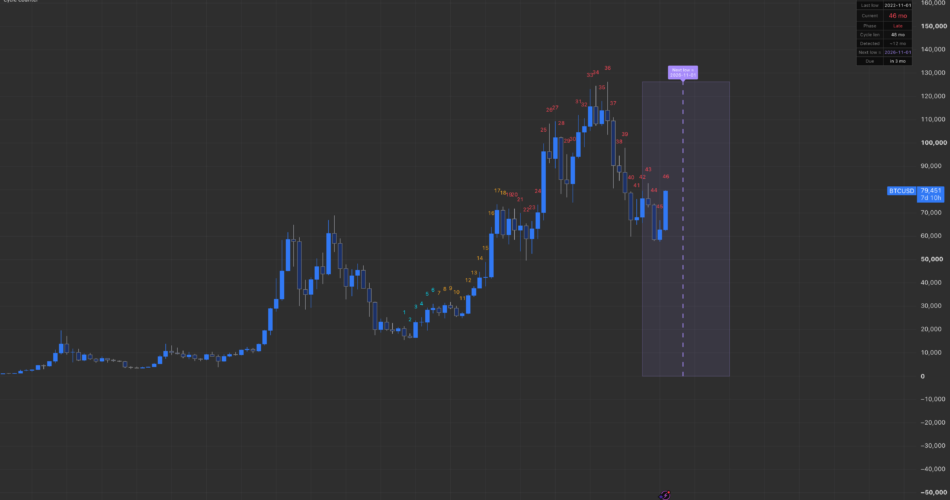
Cycle Counter measures your position inside a low-to-low price cycle that you anchor yourself. On a Daily, Weekly or Monthly chart it reports four things:
how many candles have elapsed since the cycle low
which phase of the cycle that count falls into — Early, Mid or Late
the projected date of the next cycle low
how many periods remain until that date, or how many the cycle is overdue by
It produces no entries, no exits and no buy or sell signals. It is a timing-context tool that answers “where am I in this cycle” rather than “what should I do now”.
HOW THE CYCLE START IS DEFINED
Everything the script reports is measured from a single anchored low, and you control how that anchor is set. Three methods are available in Cycle Start Method:
Manual Date — you type the exact date of the low. The date you enter does not change as new candles form.
Click on Chart — when you add the indicator you click the low candle directly. The clicked date is held once confirmed.
Auto Pivot Low — the script finds the most recent significant low using a symmetric pivot test with configurable strength, defaulting to three candles either side.
After the anchor is placed, the Snap to true lowest low option watches the first few candles from that point, defaulting to three, and re-anchors to the lowest wick it finds inside that window. This exists because a clicked candle or a typed date often lands one or two bars away from the true extreme, and without the correction every count and projection downstream inherits that error. With snap enabled the count begins at the actual low rather than the bar you happened to select, so the effective start can sit a candle or two away from the date you entered. Switch snap off if you want the count to begin exactly on your chosen date.
THE COUNT AND THE BASIS
The count is the number of candles from the anchored low to the current bar, with the low candle itself counting as 1. The unit therefore follows the chart: months on a Monthly chart, weeks on Weekly, days on Daily.
Cycle Basis set to Auto follows the chart timeframe automatically. You can also pin the basis manually. On any timeframe other than Daily, Weekly or Monthly the output is suppressed and a notice is shown instead, because a count expressed in cycle periods has no meaning on a 4-hour or 15-minute chart.
The count itself is displayed either as a number above every recent candle, or as a marker on the anchored low alone, depending on the On-Chart Display setting. When the low-marker display is active the anchored candle is recoloured, a triangle is plotted beneath it, and a dashed vertical line with a tag showing the low’s date is drawn at that candle. Auto uses numbers on Monthly and the low marker on Weekly and Daily, since a number above every candle becomes unreadable on the shorter bases.
PHASE
The elapsed count is bucketed into three phases against boundaries you set separately for each basis. The Monthly defaults treat months 1 through 6 as Early, 7 through 18 as Mid, and anything beyond as Late. Weekly and Daily carry their own boundaries and their own defaults.
Phase drives the colour of the on-chart numbers, so the ageing of a cycle is legible at a glance without reading any figure — the run of numbers shifts from the Early colour through Mid to Late as the cycle matures. The boundaries are inputs rather than fixed values because a multi-year cycle on one instrument and a multi-week cycle on another do not divide into thirds the same way.
PROJECTING THE NEXT LOW
The expected cycle length comes from one of two places. Either the manual length for the active basis — defaults are 48 months, 26 weeks and 40 days — or, with Auto-detect cycle length enabled, the average spacing between all pivot lows the script has found on the loaded history, using the same pivot strength as the Auto Pivot Low anchor.
One detail worth knowing: when the Monthly lock is on, the auto-detected length replaces the manual monthly length only while you are viewing a Monthly chart, because that is where a monthly measurement can actually be taken. On Weekly or Daily the locked projection falls back to the manual monthly length. Set your cycle length on the Monthly chart, then move down.
From the anchored low the script steps forward in whole cycle lengths until it passes the current bar, and marks that date as the projected next low. Around it, a shaded window spans that date plus and minus a percentage of the cycle length, defaulting to 15%, converted into real calendar time.
Draw projected next-low line is the master switch for this whole group: with it off, nothing is projected. With it on, the shaded window, its border, the centre dotted line and the date label can each be turned on or off separately, and the window can be set to fill the full height of the pane.
The table reports the projected date alongside a countdown, which flips to reading how many periods the cycle is overdue once the projected date passes without a low.
THE MONTHLY LOCK
Lock projection to Monthly cycle is on by default and is the part of this script that behaves differently from a plain bar counter.
With it enabled, the projection is computed in calendar months from the Monthly cycle length regardless of which chart you are looking at. The consequence is that the projected date and the window width are identical on Daily, Weekly and Monthly. You anchor the cycle low once on the Monthly chart, and every lower timeframe then inherits that same forward target rather than computing its own from its own period count.
The practical difference: without the lock, a Daily chart with a 40-day cycle length projects a low roughly 40 days out while the Monthly chart projects one years out, and the two disagree. With the lock on, you can drop from Monthly to Daily to study a setup on a finer timeframe around the projected low, and the target date does not move under you. The count still re-bases to days so you keep the finer resolution — only the projection is held constant.
WHAT IS ORIGINAL HERE
Low-to-low cycle analysis is long-established public trading theory and this script makes no claim to have originated it. What is original is the implementation.
The only built-in technical indicator used anywhere in this script is ta.pivotlow, and it appears in just two optional roles: locating an anchor when you select Auto Pivot Low, and estimating average cycle length when you enable auto-detection. Anchor manually with a fixed length and the script calls no built-in indicator at all. The only other ta. function used is ta.change, which simply detects when you edit the anchor input so the count can reset.
Everything else is written for this script specifically: the snap-to-true-low correction window, the basis-aware counting that re-expresses the same cycle in months, weeks or days, the per-basis phase boundaries with their own colour mapping, the calendar-time projection that holds a single date constant across every timeframe, and the overdue countdown.
There is no moving average, RSI, Bollinger Band, MACD, WaveTrend, stochastic or supertrend derivative in the script. It is not a mashup of existing indicators and it is not a rehash of a built-in.
WHY THESE COMPONENTS ARE ONE SCRIPT
The parts form a single chain in which each stage consumes the output of the one before it. The anchor establishes an origin. The snap corrects that origin to the true extreme. The count measures elapsed time from it. Phase interprets that count against the expected cycle length. The projection extends the same origin and length forward to a date. The table reports all of it together.
None of these is useful in isolation. A phase reading with no count has nothing to classify. A projection with no anchor has no origin to project from. Separating them into individual scripts would force a user to keep the same anchor date synchronised by hand across several indicators, and any drift between them would silently corrupt every reading.
HOW TO USE IT
Open the Monthly chart of the instrument you want to track.
Add the indicator. With Click on Chart selected you will be asked to click a candle — click the cycle low you want to measure from. Alternatively choose Manual Date and type the date.
Check the Last low row in the table shows the date you intended. If it has moved by a candle or two, that is the snap finding a lower wick nearby.
Set the Monthly cycle length to whatever your framework expects, or switch on auto-detect and read the Detected row to see what the loaded history suggests.
Leave the Monthly lock enabled, then drop to Weekly or Daily. The count re-bases to weeks or days while the projected low date stays where it was.
Reading the output: a Late-phase count approaching the projected window is the cautious configuration, since the cycle is both old and near its expected turn. An Early-phase count well short of the window is the opposite. The Due row is the fastest read in the table — “in 3 mo” and “overdue 5 mo” are very different situations even at the same phase.
SETTINGS
Cycle Basis — Auto follows the chart, or pin to Monthly, Weekly or Daily.
Cycle Start — the method, the click target, the manual date, and the pivot strength used by Auto Pivot Low.
On-Chart Display — Auto shows numbers on Monthly and a highlighted low candle on lower timeframes; you can also force Numbers or Low Marker. Includes the highlight colour and a cap on how many recent bars carry numbers, defaulting to 60, which keeps long histories readable.
Projection — the Monthly lock, the next-low line master switch, the shaded window, full-height fill, border, centre line, label, the window tolerance as a percentage of cycle length, and colour.
Accuracy — snap to true lowest low, the snap search window, and whether to hide output on unsupported timeframes.
Number Appearance — plain text or label box, text size, and box text colour.
Phase — Monthly / Weekly / Daily — the Early and Mid boundaries for each basis.
Cycle Length — the auto-detect toggle and the manual length for each basis.
Phase Colors — Early, Mid and Late.
Table — show or hide, and corner position.
LIMITATIONS
Manual Date and Click on Chart do not repaint. The anchor is a fixed timestamp and every value derived from it is stable across reloads.
Auto Pivot Low does repaint. A pivot is only confirmed once the configured number of candles have printed past it, and if a new qualifying low forms later the anchor jumps to it and every count, phase and projection shifts accordingly. Anchor manually if you need stability.
The snap can move the anchor by up to the configured window during the first candles of a cycle.
The projection is arithmetic, not a probability estimate. It assumes the next cycle runs the same length as the configured or measured one, and real cycles stretch and compress.
Auto-detected length is a plain average of pivot spacings across the loaded history. It is only as good as the pivot strength setting and how much history the chart has loaded, and on noisy series it will underestimate true cycle length.
Window fills full height extends the box far beyond the data and will compress the price scale unless you right-click the price axis and enable Scale price chart only.
On instruments with no persistent cyclicality the outputs are arbitrary.
Source link
Author

- Ytv Market News
- Share-market news writer and analyst with deep experience covering equities, commodities, forex, and cryptocurrencies for readers in the USA, UK, Canada, and Australia. Ytv Market News delivers timely market updates, practical trading insights, and clear explanations of macro and company-level catalysts that move prices. Combines on-the-ground financial reporting with technical analysis, using concise charts and actionable ideas to help investors and traders make smarter decisions.
Latest entries
 Crypto NewsAugust 24, 2026Strategy raises $2B, pauses Bitcoin purchases
 CanadaAugust 24, 2026AMAPÁ MINERALS ANNOUNCES PARTIAL EXERCISE OF OVER-ALLOTMENT OPTION
 AustraliaAugust 24, 2026Li-S Energy Delivers First Lithium-Sulfur Cells to US Army for Independent Testing
 UsaAugust 24, 2026Robinhood CEO Vlad Tenev Is Betting Big on the Future of Tokenization. Here’s What That Means for the Average Crypto Investor.

