

═══════════════════════════════════════════════
🔶 OVERVIEW
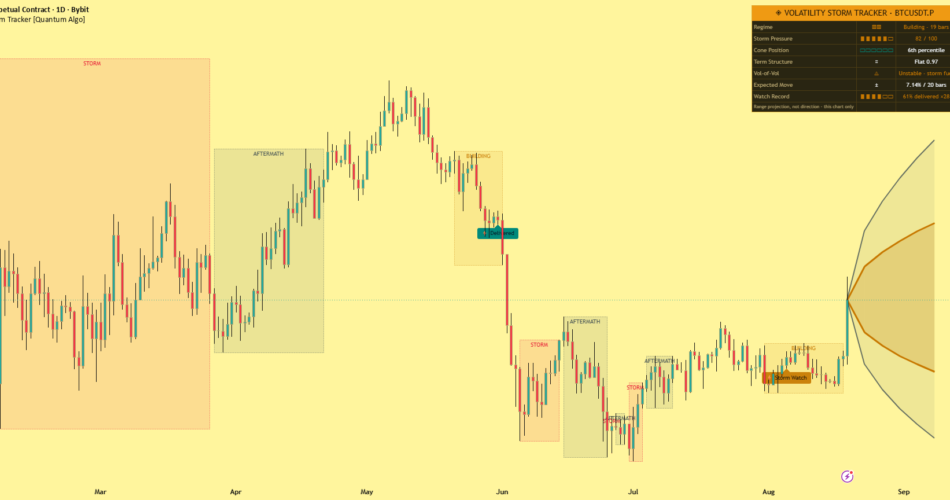
Volatility Storm Tracker treats volatility the way meteorologists treat weather: as a system with structure, pressure, and a lifecycle. Volatility clusters. It compresses before it releases. Its term structure inverts under stress. This indicator measures all of it with professional range-based estimators, locates current volatility inside its own historical cone, charges a Storm Pressure gauge while compression builds, boxes each phase of the storm lifecycle directly on the chart — BUILDING, STORM, AFTERMATH — and projects the statistical expected-move cone forward from live price like a hurricane track.
Its one predictive claim is deliberately narrow and deliberately measurable: after deep, sustained compression, expansion follows. Direction is never predicted — expansion is. And every Storm Watch marker settles publicly into “Delivered” or “Fizzled” depending on whether the expansion actually arrived, so the chart always displays the tool’s honest historical record on your exact symbol.
═══════════════════════════════════════════════
🔶 WHAT IS REALIZED VOLATILITY AND WHY DO ESTIMATORS MATTER?
Realized volatility measures how much price actually moves. The naive approach uses only closing prices and throws away most of the information in every bar. Range-based estimators use the full open, high, low and close: Parkinson (1980) exploits the high-low range, Garman-Klass (1980) adds the open-close body, Rogers-Satchell (1991) handles drift, and Yang-Zhang (2000) combines overnight gaps, intraday movement and drift into the most efficient practical estimator — the standard on professional volatility desks. This tool computes the full suite and uses Yang-Zhang as its engine.
═══════════════════════════════════════════════
🔶 WHAT IS A VOLATILITY CONE?
A number like “volatility is 2.4%” means nothing in isolation — is that high or low for this symbol, on this timeframe? The volatility cone, introduced by Burghardt and Lane (1990), answers by ranking current volatility as a percentile inside its own recent history. The 8th percentile means deep compression for THIS market; the 92nd means a live storm. Every definition in this tool is relative to the symbol’s own behavior — nothing is hard-coded.
═══════════════════════════════════════════════
🔶 WHAT IS VOLATILITY TERM STRUCTURE?
Short-horizon volatility compared to long-horizon volatility. In calm conditions the short reading sits below the long one (contango). When the short reading rises ABOVE the long one (backwardation), recent movement is violent relative to the established baseline — the classic stress signature options desks watch. The dashboard reads this as Contango, Flat, or Backwardation with the live ratio.
═══════════════════════════════════════════════
🔶 WHY IS THIS ORIGINAL?
1. A professional estimator suite on the chart. Yang-Zhang as the engine, with Parkinson and Garman-Klass computed alongside and readable in the dashboard tooltip — mathematics standard on volatility desks and almost never implemented on this platform.
2. Storm Pressure. A charged gauge built from three measurable ingredients: how deep volatility sits in its cone, how long the compression has lasted, and how unstable volatility itself has become (volatility-of-volatility). Pressure is the tool’s early warning — it rises while the chart still looks quiet.
3. The storm lifecycle, boxed and labeled. Each phase is drawn around its own price action: BUILDING in amber, STORM in red, AFTERMATH in slate, with calm periods left clean. Scrolling back reads as a storm history — volatility clustering made visible.
4. The expected-move cone. From live price, the tool projects the one- and two-standard-deviation statistical range forward with the correct square-root-of-time curvature — a hurricane-track cone for price. It is a range projection, never a direction forecast, and it is labeled as such.
5. Settling markers and a public record. Every Storm Watch resolves after a fixed window into Delivered (a move of at least the threshold arrived) or Fizzled. The dashboard’s Watch Record row reports the delivery rate with sample count, shrunk toward neutral at small samples, with a Wilson lower bound. The tool grades its own homework where everyone can see it.
═══════════════════════════════════════════════
🔶 HOW IT WORKS
— Each bar, the estimator suite computes realized volatility from the full price range, gaps included.
— Current volatility is ranked inside its historical cone; term structure and volatility-of-volatility are updated.
— Storm Pressure charges during deep, persistent, unstable compression and prints a Storm Watch when it crosses the watch threshold.
— A Storm confirms when volatility enters the top of its own cone; the regime machine transitions Calm → Building → Storm → Aftermath and boxes each phase on the chart.
— After the settle window, each Watch is recolored by outcome, and results feed the statistics.
All detection happens on confirmed bars; settled markers never change. The forward cone is a live projection that updates with volatility — it is explicitly a statistical range, not a prediction of path or direction.
═══════════════════════════════════════════════
🔶 HOW TO USE IT
— Breakout preparation: a charged Pressure gauge inside a BUILDING box is the environment where breakout strategies earn their keep; the Watch Record tells you how reliably expansion has followed on this symbol.
— Position sizing: the Expected Move row translates current volatility into a concrete ±percentage over your horizon — a rational basis for stop distances and size.
— Options context: the cone position and term structure describe whether movement is cheap or expensive relative to this market’s own history.
— Regime filtering: many strategies work in exactly one regime. The boxes tell you, at a glance, which regime any historical trade lived in — and which one you are in now.
— Works on all markets and timeframes from 15m to Weekly; everything is self-relative, so nothing needs retuning per symbol.
═══════════════════════════════════════════════
🔶 SETTINGS
— Volatility Engine: estimator length, term-structure windows, historical cone window.
— Storm Detection: watch pressure threshold, storm percentile, delivered-move threshold, settle window, markers kept.
— Expected Move Cone: projection toggle and horizon.
— Statistics: sample cap, minimum samples, shrinkage strength, Wilson z-score.
— Full color, regime-box and dashboard customization.
═══════════════════════════════════════════════
🔶 ALERTS
— Storm Watch — pressure crossed the watch threshold; expansion conditions are charged.
— Storm Confirmed — volatility entered the top of its historical cone.
— Calm Restored — the storm cycle completed.
— Term Structure Inverted — short-horizon volatility exceeded long-horizon; stress regime.
═══════════════════════════════════════════════
🔶 FAQ
Q: Does it predict direction?
A: No — and that is the point. Direction after compression is genuinely uncertain; expansion is not. The tool makes only the claim volatility mathematics can support, and then measures that claim on your chart via the settled markers and the Watch Record.
Q: Does it repaint?
A: No. Watches, storms and regime transitions are detected on confirmed bars, and settled markers are permanent. The forward cone updates live because it is a projection from current conditions — it is drawn to the right of price and never alters past signals.
Q: What does “Delivered” mean on a settled marker?
A: That price moved at least the configured threshold (in Average True Range units, in either direction) within the settle window after the Watch. “Fizzled” means it did not. Both outcomes stay on the chart.
Q: Why Yang-Zhang instead of a simple standard deviation of closes?
A: Close-to-close volatility ignores gaps and intrabar range, making it slow and noisy. Yang-Zhang uses the full bar plus the overnight gap and is dramatically more efficient — the same reading quality from far fewer bars, which matters enormously for adaptive thresholds.
Q: Which markets does it suit?
A: All of them — crypto, stocks, indices, forex, commodities. Every threshold is defined relative to the symbol’s own volatility history, so the tool recalibrates itself wherever you load it.
═══════════════════════════════════════════════
🔶 CREDITS
Range-based volatility estimators by Michael Parkinson (1980), Garman and Klass (1980), Rogers and Satchell (1991), and Yang and Zhang (2000). Volatility cones after Burghardt and Lane (1990). Volatility clustering first documented by Benoit Mandelbrot (1963) and formalized in the ARCH family by Robert Engle (1982), referenced as conceptual context. The Wilson score interval is by Edwin B. Wilson (1927). The storm pressure model, regime state machine, settling audit, per-symbol statistics and all code in this script are original work — no third-party or open-source script code was reused.
═══════════════════════════════════════════════
🔶 LIMITATIONS
— Expansion timing is probabilistic: pressure can stay charged longer than expected, and some Watches fizzle — the record row exists precisely to quantify this on your chart.
— The expected-move cone assumes volatility measured today persists over the horizon; regime shifts mid-projection will widen or narrow the true range.
— Statistics describe the current chart’s history only; past frequencies never guarantee future outcomes.
═══════════════════════════════════════════════
🔶 DISCLAIMER
This indicator is a research and charting tool provided for educational purposes. It is not financial advice, and nothing it displays is a recommendation to buy or sell any asset. Trading involves substantial risk of loss. Always do your own analysis and manage risk responsibly.
Source link
Author

- Ytv Market News
- Share-market news writer and analyst with deep experience covering equities, commodities, forex, and cryptocurrencies for readers in the USA, UK, Canada, and Australia. Ytv Market News delivers timely market updates, practical trading insights, and clear explanations of macro and company-level catalysts that move prices. Combines on-the-ground financial reporting with technical analysis, using concise charts and actionable ideas to help investors and traders make smarter decisions.
Latest entries
 CanadaAugust 24, 2026Cyient Unveils New Brand Positioning ‘Nothing Less’
- UkAugust 24, 2026US stock futures rebound as oil and bond-market pressures remain in focus: Dow Jones, S&P, Nasdaq, Wall Street
 AustraliaAugust 24, 2026Jade Gas Defines Production Licence Area as TTCBM Moves Towards Development
 UsaAugust 24, 2026Delek Logistics EVP Hobbs Buys 4,000 Shares for $200,000

