


Shiba Inu is finding it difficult to sustain its most recent rebound as a key exchange metric declines precipitously. One of the signals that had previously supported the bullish reversal has been weakened by SHIB’s seven-day moving average of mean exchange outflows, which has decreased by approximately 42% to 48%, depending on the observation point.
Shiba Inu’s sharp decline
In general, exchange outflows track tokens as they depart from centralized trading platforms. High outflows over time may be a sign that holders are transferring SHIB into private wallets instead of keeping it on the market right away. A sharp decline does not automatically mean investors are selling, but it shows that this source of potential supply reduction has lost considerable momentum.
The exchange data in general is still conflicting. While the mean inflow increased by 0.79 percent, SHIB’s overall exchange inflow increased by 0.56 percent. Simultaneously, the total outflows increased by 0.59 percent. Most significantly, at about -62.5 billion SHIB, the total exchange netflow is still extremely negative.
Therefore, the outflow decline alone does not confirm that holders have suddenly started depositing large amounts of SHIB onto exchanges. Rather, the data indicates that withdrawals have become less intense. The price of SHIB is up against yet another significant obstacle, and the price action increases the importance of the situation.
You Might Also Like

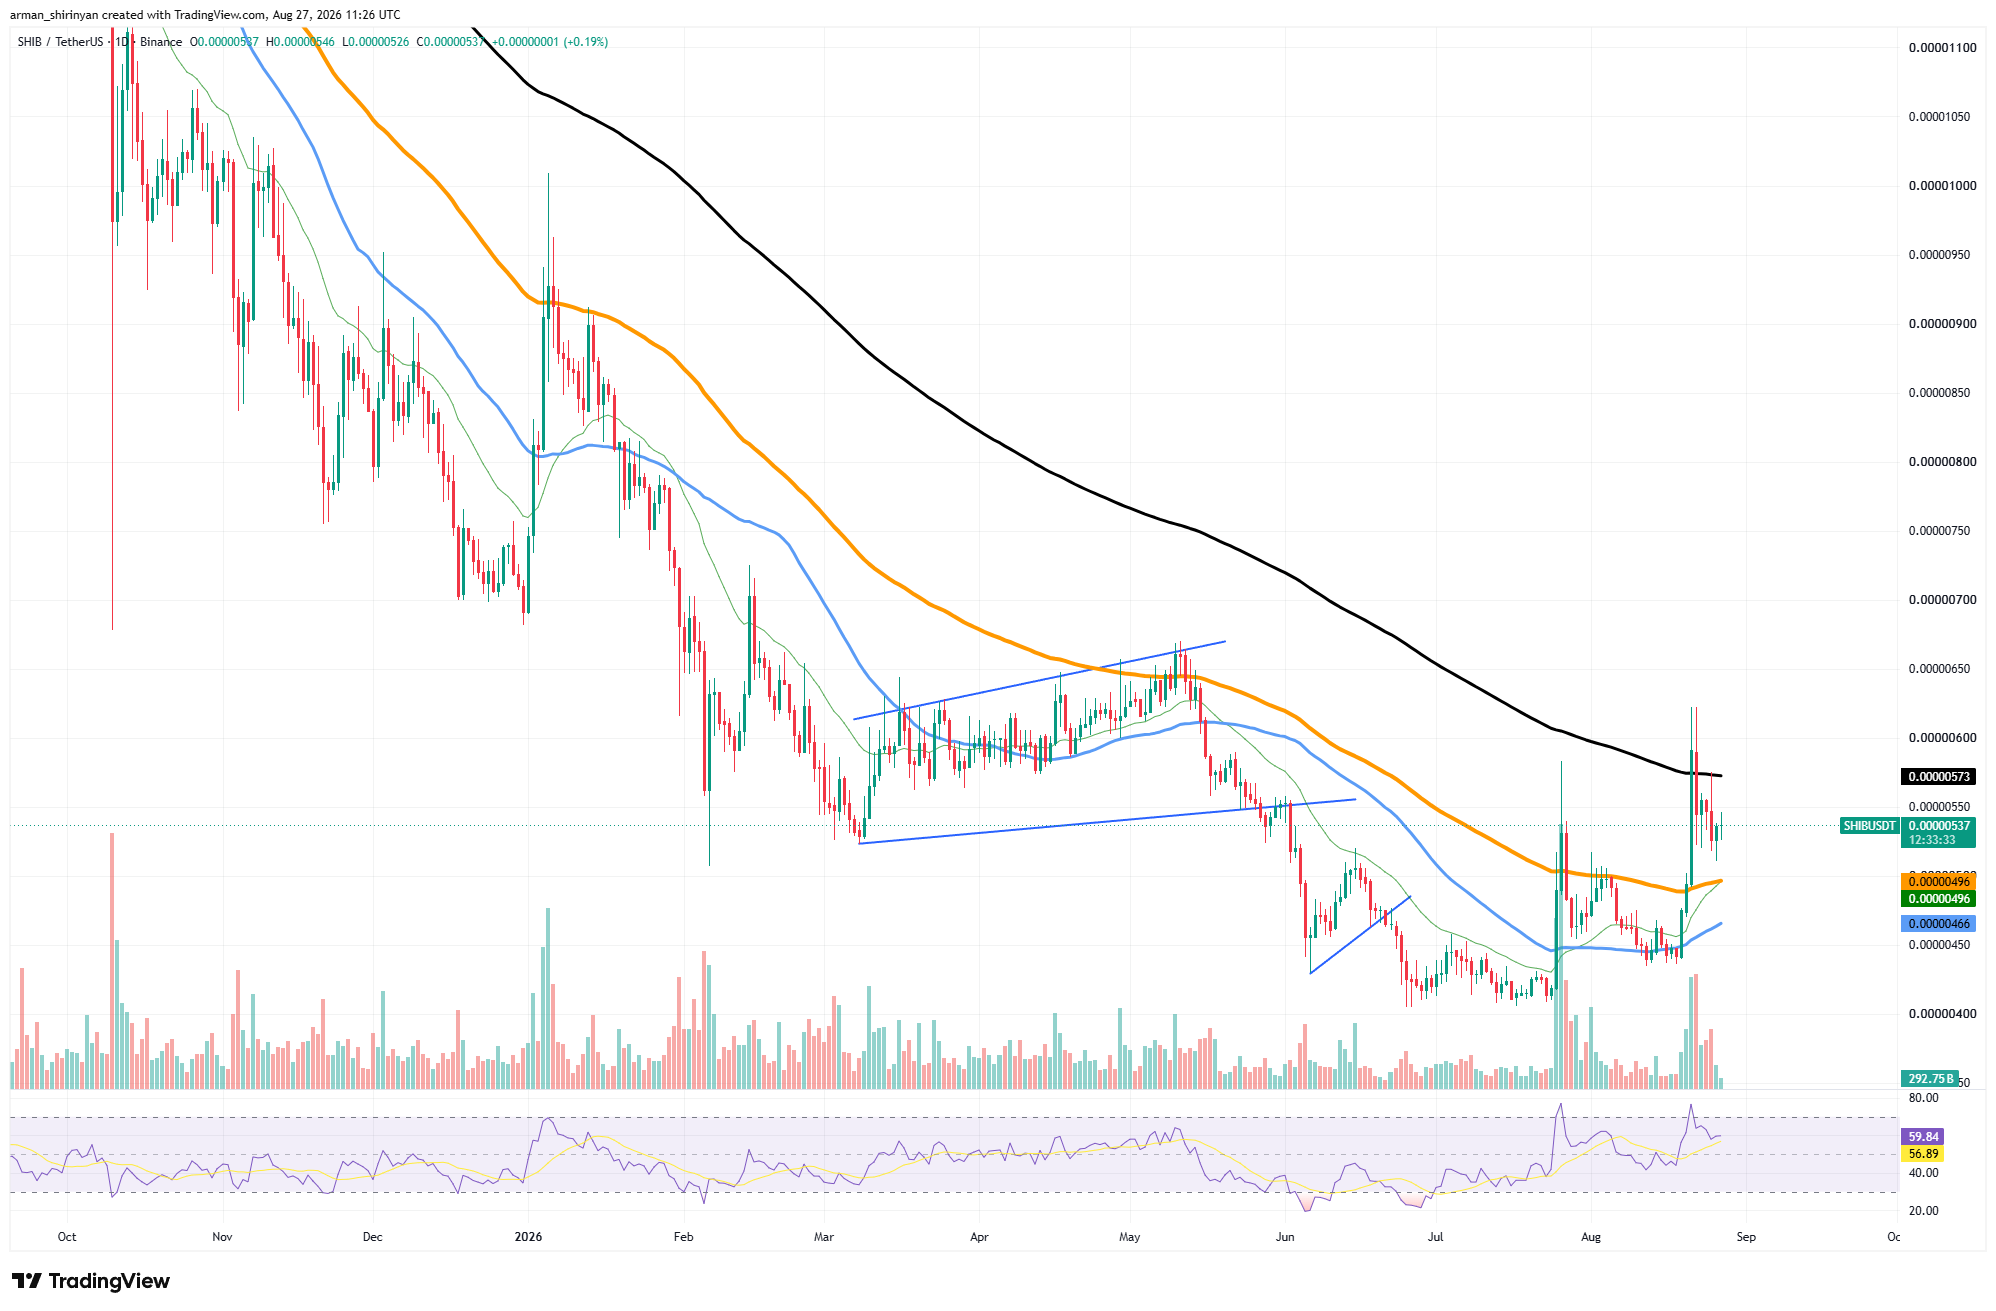
After an explosive recovery from roughly $0.0000042, SHIB is currently trading around $0.00000535. The token briefly surpassed $0.0000060 during the rally before sellers swiftly pushed it back. The long-term moving average is located at $0.00000573, which is the biggest immediate technical barrier.
Bullish reversal ends
This area has already been tested by SHIB, but it was unable to establish itself above it. Positively, the token is still well above the shorter moving averages, which are grouped around $0.00000466 and $0.00000496. After becoming overbought during the initial rally, the RSI has also cooled to about 60, lessening some of the short-term overheating.
Therefore, it would be premature to declare the bullish reversal over. Although SHIB’s improved technical structure has not yet been destroyed, it has lost momentum. The recovery case would be significantly strengthened and $0.0000060–$0.0000063 would come back into focus with a decisive move above $0.00000573.
Conversely, losing the $0.0000049–$0.0000050 area would indicate that the breakout is failing and expose SHIB to another test of the lower support zone.
Source link
Author

- Ytv Market News
- Share-market news writer and analyst with deep experience covering equities, commodities, forex, and cryptocurrencies for readers in the USA, UK, Canada, and Australia. Ytv Market News delivers timely market updates, practical trading insights, and clear explanations of macro and company-level catalysts that move prices. Combines on-the-ground financial reporting with technical analysis, using concise charts and actionable ideas to help investors and traders make smarter decisions.
Latest entries
 Stock Market VideosAugust 27, 2026Is Someone Front-Running a $20K Gold Revaluation?
 Investing InsightsAugust 27, 2026Gold Fields (GFI) Rides A Gold Price Surge To Record Cash Flow
 UsaAugust 27, 2026Here’s My Top Space Stock to Buy Right Now, And Why It’s Better Than SpaceX
 AustraliaAugust 27, 2026Buy, hold, sell: Coles, Paladin Energy, and Woodside shares


