


Bitcoin price held near $79,500 on Aug. 27 after a rapid breakout from the $63,000 area, with ETF demand and U.S. policy developments supporting the rally even as technical indicators warned that momentum may be stretched.
Summary
- Bitcoin price traded near $79,500 after gaining roughly 25% from its mid-August consolidation range.
- Daily RSI reached 81.14, placing BTC firmly in overbought territory.
- The 4-hour Supertrend remained bullish while MACD showed fading short-term momentum.
- Liquidation clusters near $81,000 and $77,500 could shape Bitcoin’s next move.
Bitcoin price holds above its breakout zone
According to data from crypto.news, Bitcoin (BTC) price was trading at approximately $79,473 at the time of writing. The price reached an intraday high of $80,520 after opening near $79,024.
BTC has gained roughly 25% since breaking out of a narrow range near $63,000 on Aug. 19. The advance took the asset above $80,000 before sellers blocked attempts to extend the rally through the $81,000–$82,000 region.
The daily chart shows Bitcoin trading above its four tracked simple moving averages. The 20-day SMA stood at $69,711, while the 200-day SMA was near $69,257. The 50-day and 100-day averages were positioned at $66,457 and $66,224, respectively.
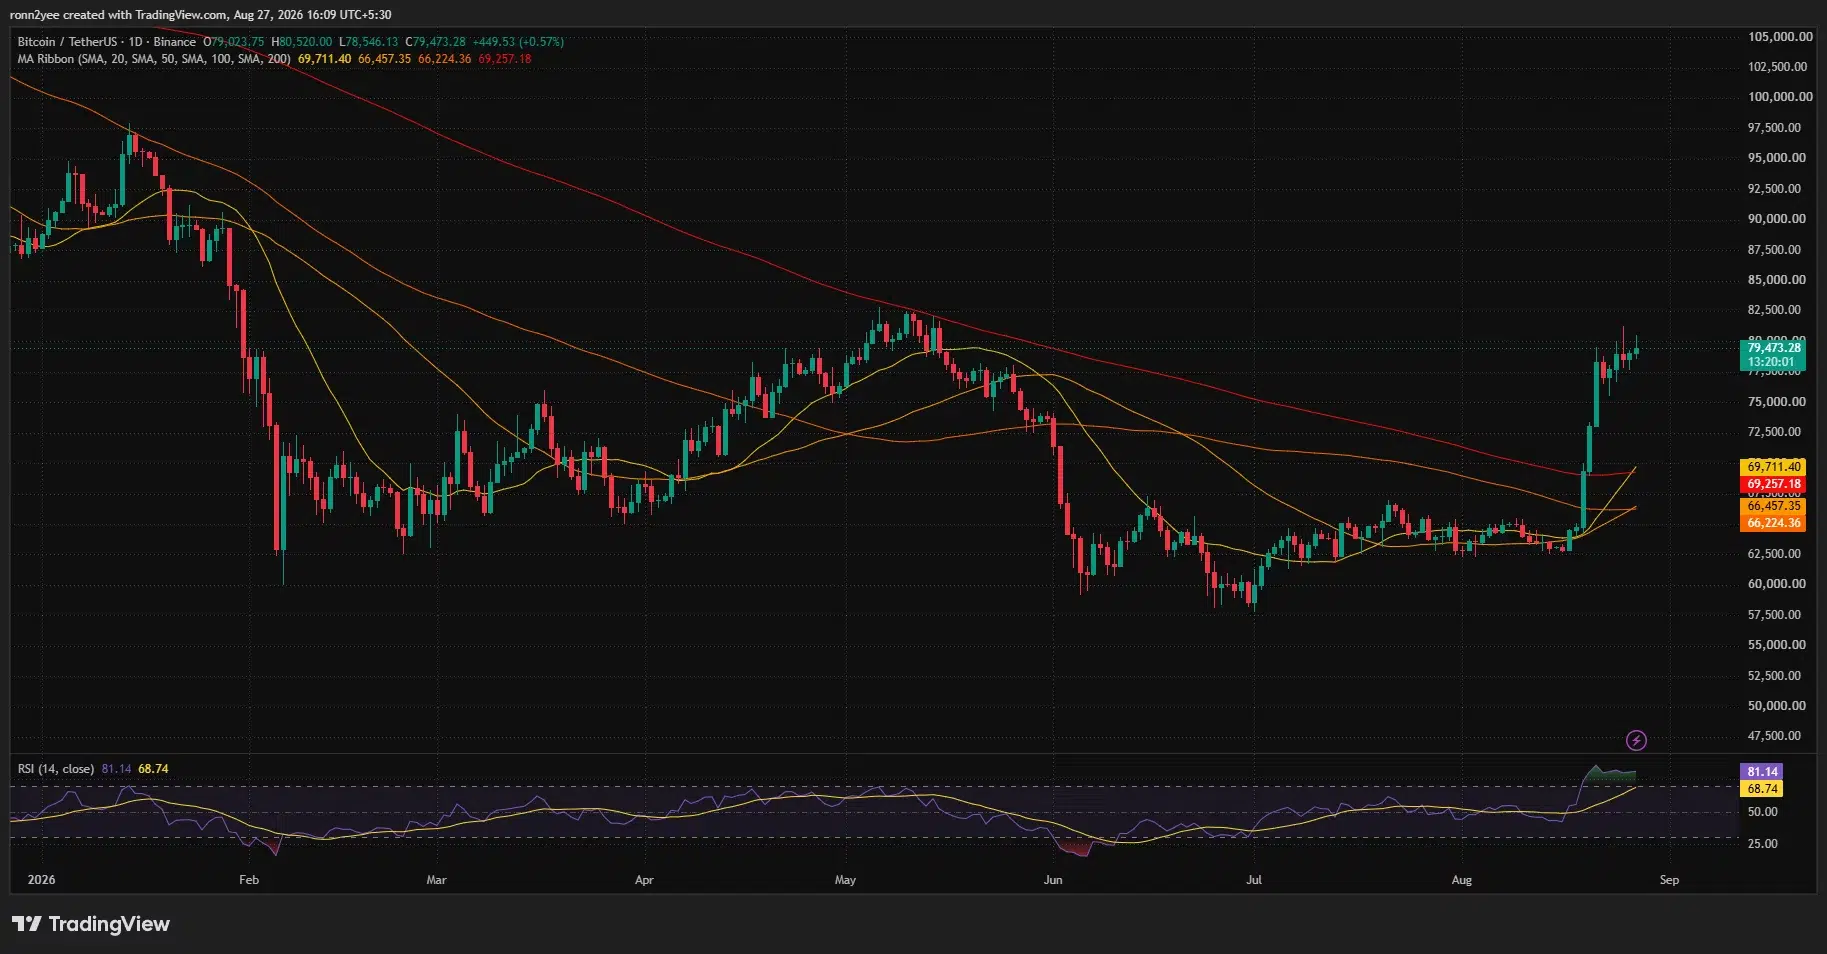
Trading above all four averages supports the broader recovery, but the moving averages have not yet produced a confirmed bullish golden cross. The 20-day average remains only slightly above the 200-day line, leaving traders to watch whether the separation expands or reverses.
The daily relative strength index reached 81.14, well above the conventional overbought threshold of 70. Such a reading shows strong buying momentum but also raises the possibility of profit-taking after the steep advance.
Treasury buybacks and ETF inflows supported Bitcoin
Bitcoin’s breakout followed an Aug. 19 announcement from the U.S. Treasury that it would at least double the maximum size of long-end liquidity-support buybacks.
The department said operations involving nominal securities in the 10-to-20-year and 20-to-30-year sectors would increase from a maximum of $2 billion to at least $4 billion per operation. The larger operations will begin on Sept. 9 and continue through Nov. 4. The Treasury described the change as support for liquidity in longer-dated government debt markets.
The announcement improved market expectations around Treasury-market liquidity, although it did not represent an immediate injection of funds because the expanded operations have not yet started. Bitcoin’s reaction also coincided with renewed demand through U.S. investment products and improving expectations for crypto legislation.
U.S.-listed spot Bitcoin exchange-traded funds attracted approximately $1.92 billion in the week through Aug. 21, according to SoSoValue data. BlackRock’s IBIT accounted for about $1.33 billion of those inflows.
The ETF group recorded its strongest week since October 2025, but the funds remained roughly $2.91 billion in net outflows for 2026. The combination suggests institutional demand returned sharply during the breakout without fully reversing the weakness seen earlier in the year.
Political expectations also contributed to sentiment after President Donald Trump renewed calls for Congress to advance crypto market-structure legislation. The proposed CLARITY Act remains subject to congressional action, meaning its effect on sentiment does not amount to final regulatory certainty.
Bitcoin momentum cools on the 4-hour chart
The 4-hour chart shows that Bitcoin’s trend remains bullish despite weakening momentum.
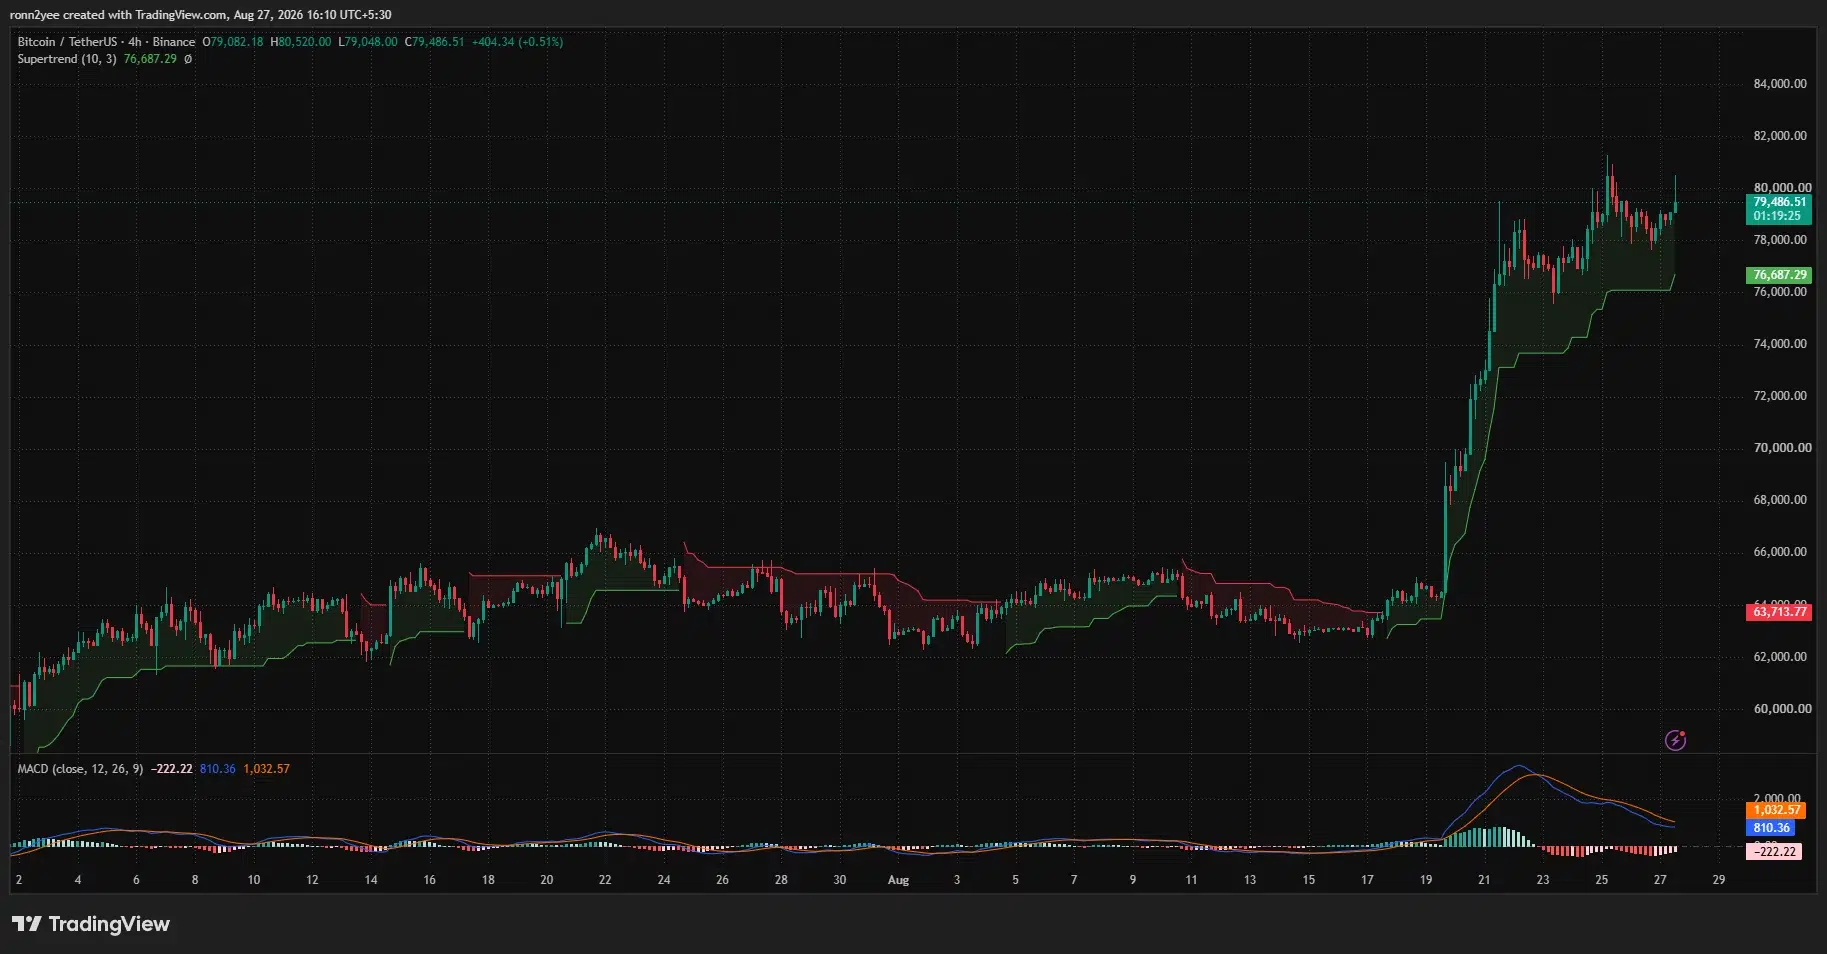
BTC was trading above the Supertrend indicator, which had moved up to $76,687. Holding above that level would preserve the sequence of higher lows established after the breakout.
The moving average convergence divergence indicator presented a more cautious picture. The MACD line stood near 810, below the signal line at approximately 1,033, while the histogram remained negative at minus 222.
The bearish MACD crossover suggests the rally has lost some short-term force since Bitcoin tested $81,000. However, the negative histogram bars were beginning to contract on the chart, indicating that downside momentum may also be easing.
Price action has formed a short consolidation between approximately $78,000 and $80,000. A close above $80,500 would allow buyers to challenge the recent high around $81,200, followed by the May peak near $82,800.
A weekly close above the 365-day moving average near $83,000 would provide a stronger long-term confirmation. Until then, Bitcoin remains below a resistance area that previously rejected price advances.
Liquidity concentrates around $81K and $77.5K
The one-week CoinGlass liquidation heatmap shows leveraged positions building on both sides of Bitcoin’s current price.
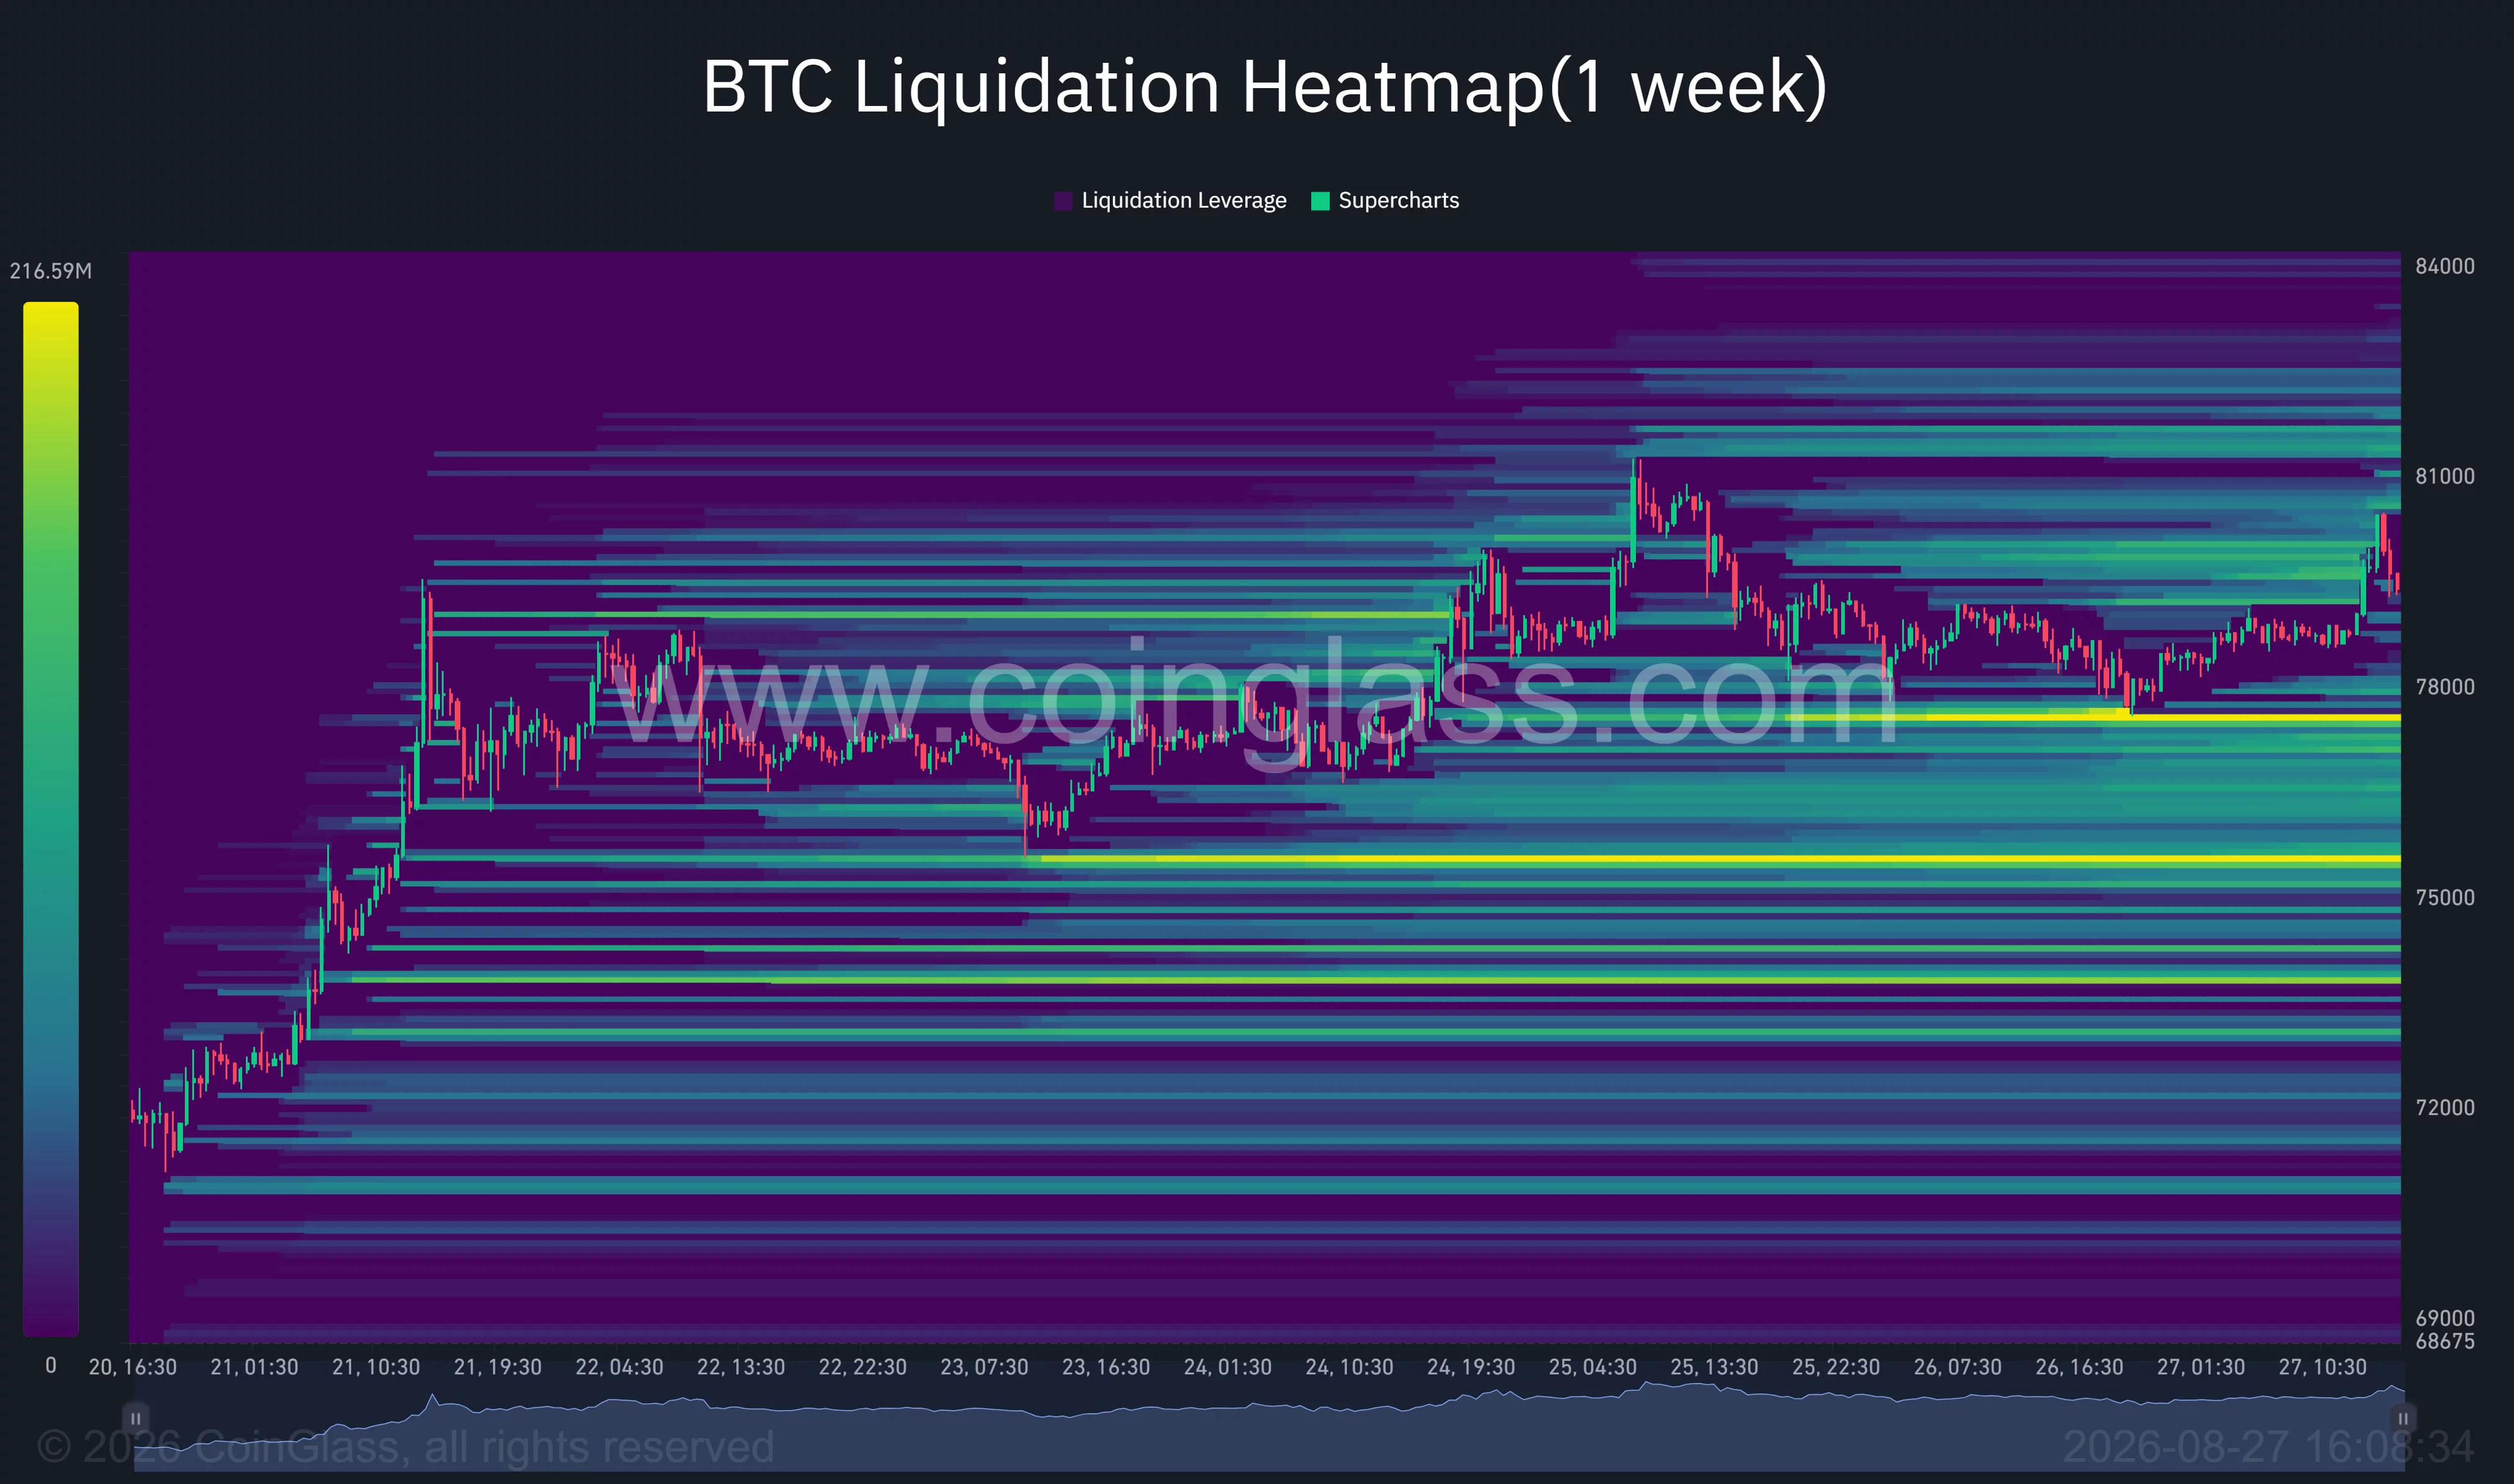
The nearest major concentration above the market sits around $80,000–$81,000. A clean break through that zone could force short sellers to close positions, potentially adding momentum toward liquidity near $81,500 and $84,000.
The strongest nearby downside cluster appears around $77,300–$77,700. Further liquidity is visible close to $75,500, making the two areas possible targets if Bitcoin loses its current range.
On-chain analyst Einstein BTC identified $75,900 as the newest short-term holder cost basis. According to the analyst, Bitcoin was trading only about 3.4% above that level, making it an important dividing line for the short-term structure.
The chart provides nearer support at $76,687 through the 4-hour Supertrend. A fall below that indicator would increase the probability of a move toward the $75,900 cost basis and the heatmap’s $75,500 liquidity cluster.
Another market commentator, Crypto with Haris, argued that repeated rejection below $82,000 could expose $74,000 and eventually $67,000. The forecast represents a bearish scenario rather than a confirmed outcome, with Bitcoin still holding above its immediate technical supports.
Bitcoin faces an overbought test near $80K
Bitcoin’s next move depends on whether buyers can absorb selling near $80,000 while defending the $77,500–$76,700 support area.
A daily close above $81,200 would weaken the immediate bearish case and open a path toward $82,800 and the 365-day average near $83,000. Liquidations above the market could accelerate such a move.
Failure to clear resistance, combined with an RSI above 80 and a bearish 4-hour MACD crossover, would leave Bitcoin vulnerable to a cooling period. The first test would sit near $77,500, followed by the Supertrend at $76,687 and the short-term holder cost basis around $75,900.
The larger trend remains constructive while BTC trades above its major daily moving averages. However, the overbought RSI and concentrated leverage on both sides of the market suggest the next breakout could produce another sharp move rather than a gradual change in direction.
Disclosure: This article does not represent investment advice. The content and materials featured on this page are for educational purposes only.
Author

- Ytv Market News
- Share-market news writer and analyst with deep experience covering equities, commodities, forex, and cryptocurrencies for readers in the USA, UK, Canada, and Australia. Ytv Market News delivers timely market updates, practical trading insights, and clear explanations of macro and company-level catalysts that move prices. Combines on-the-ground financial reporting with technical analysis, using concise charts and actionable ideas to help investors and traders make smarter decisions.
Latest entries
 UkAugust 27, 2026Wall Street futures climb as Nvidia fuels renewed AI optimism: Dow Jones, S&P, Nasdaq
- Crypto NewsAugust 27, 2026Top Ethereum Price Predictions as ETH Rises Above $2,500
 Crypto NewsAugust 27, 2026Bank of England gets new stablecoin innovation goal
 Stock Market VideosAugust 27, 2026Is Someone Front-Running a $20K Gold Revaluation?


