

Your chart shows one coin at a time. This indicator watches a basket of 20 coins at once and answers the question a single chart cannot: out of those 20, how many are actually taking part in the move you are looking at right now.
That answer changes what the same candle means. If Bitcoin gains five percent and 17 of the 20 coins gain with it, the whole market is moving and the move has something under it. If Bitcoin gains the same five percent while only 3 coins follow, one name is carrying everything and the rest of the market has already turned away. On a price chart those two days look identical. Here they do not, and that difference is the entire product.
Two lines do the work. The first is participation: how many coins of the basket are trading above their own moving average, drawn as a percentage from 0 to 100. Fifty means half the market is holding up, ten means almost nothing is. The second is pressure: on every bar it counts how many coins closed up against how many closed down and adds that difference up over time, so it reacts far sooner than the first line, often weeks sooner.
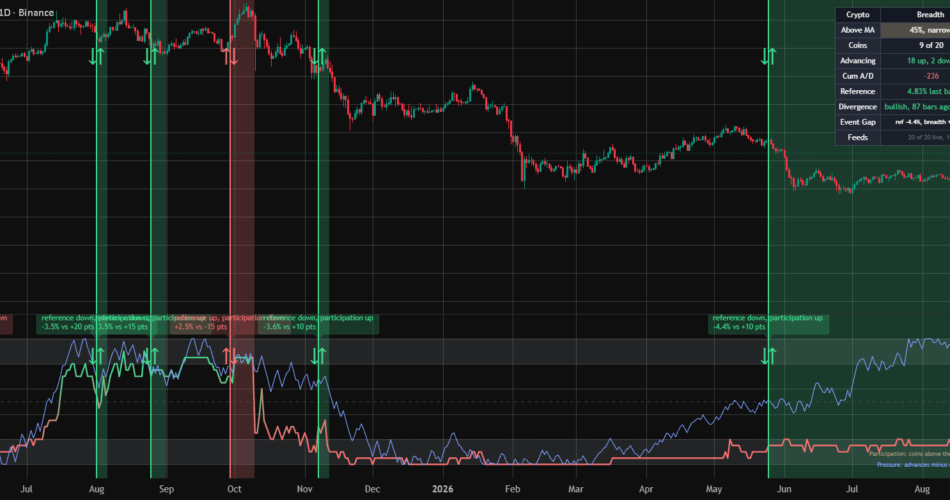
The indicator then watches Bitcoin and participation together. While they move the same way, nothing is drawn. When they split and go opposite ways, the stretch of time between them is shaded red or green and stays shaded until they come back together. Red means price is being pulled up while fewer and fewer coins follow it. Green means price is falling while more and more coins are quietly recovering underneath it.
One example from the daily chart of Bitcoin: the reference gained 2.5 percent across the comparison window while participation fell 15 points, which is two coins out of twenty losing their average. Both numbers are printed in the table on the chart, so every shaded stretch states its own reason instead of leaving you to guess it.
None of this tells you where to buy. It tells you whether the trade your own system just found deserves full size, half size, or nothing at all.
HOW TO USE IT
- Participation above 50 and rising
Means: the market is broad, most of the basket holds its average.
Do: take your signals at full size. The only state where adding makes sense. - Participation between 30 and 50
Means: the move is carried by a few names.
Do: half size, closer targets. - Participation below 30
Means: breakouts in the basket mostly fail.
Do: stand aside, or trade the reference symbol alone. - Participation above 80
Means: everybody is already in, advances are crowded.
Do: not a place to open. Reduce and tighten the stop. - A red band opens
Means: the reference is being carried while participation leaks away.
Do: stop adding, protect what is open. A warning, not an exit, and it can run for weeks. - A green band opens while participation is below 20
Means: the reference is falling while more members repair underneath it.
Do: prepare, do not enter yet. This stage can last weeks. - Participation then crosses 50 upward
Means: the repair is confirmed by the state, not only by pressure.
Do: the entry window of the reversal sequence. Late by design, verified by design. - A band closes
Means: the pair moved the same way again, the disagreement is resolved.
Do: the warning is lifted. - Participation crosses 50 downward
Means: most of the basket has lost its average.
Do: the last and bluntest exit reason.
Five alerts cover this without watching the screen: participation crossing above and below half, the two divergence conditions, and the bar an open disagreement closes.
A WORKED EXAMPLE, THE DAY THIS WAS PUBLISHED
In the middle of May a green stretch opened on the daily chart of Bitcoin. The reference had lost 4.4 percent across the comparison window while participation rose 10 points against it, which is two coins out of twenty regaining their average while price was falling. Both numbers sit in the Event Gap row of the table.
Price then kept sliding into June and spent the next two months going sideways near its lows. The shading stayed on the entire time, because the two measurements never pointed the same way again. That is the length doing its job: this was not a three bar flicker, it was a repair that took a quarter to play out underneath a price chart that looked dead.
On the day of this publication the stretch ended. Bitcoin closed 4.7 percent higher and participation rose with it, so the pair agreed again, the band closed on that bar and the table switched to closed.
Now read the states above against this exact picture. Participation is 45 percent, nine coins of twenty above their average. That is the half size row, not the full size one. The reversal sequence has completed two of its three steps, the washed out low and the repair, and the third one, participation crossing 50 from below, has not happened yet.
That is the entire use of the tool in one screen. It does not say what the next bar does. It says the move that just printed a large green candle is still not broad, and it says so with a count anyone can check.
A bearish disagreement on the daily chart of Bitcoin, October 2025. Price makes its high while the share of the basket above its own average falls away underneath it.
THE TWO LINES
Participation is a state. It moves only when a member crosses its average, which is a large event, so the line is slow and honest.
Pressure reacts on every bar and needs no threshold, so it turns while participation is still standing still. It counts members, not money: a coin up a tenth of a percent and a coin up twelve percent cast one vote each. There is no volume in it and no order flow. That is a limitation worth stating plainly, and it is also why one large member cannot distort it.
The gap between them is the point. Participation on the floor while pressure climbs is a market being bought before it looks bought. Participation high while pressure rolls over is a rally already finished. Neither statement can be made from one line.
THE DIVERGENCE
One window, two measurements, no pivots. The reference symbol, Bitcoin by default, must travel at least the configured percentage across the window while participation moves the other way by at least the configured number of points.
The event is measured on participation alone. The pressure line takes no part in it: hide it and not one band, glyph or alert changes. Participation sits on a fixed scale where ten points has a stated meaning, two members out of twenty changing sides, while pressure is normalised against its own recent range, where ten points would mean nothing statable. Thresholds that cannot be explained in plain language have no business triggering anything. Read together, a band with pressure agreeing is a warning confirmed twice, a band against it is the narrow kind that more often dissolves.
A disagreement is a stretch, not a moment. A vertical line marks the bar it opened and a band runs until the pair comes back together, which happens when both measurements point the same way again. The length is the part worth reading: one that closes after three bars was noise, one that holds for two months is the story of that market.
Agreement produces nothing at all. Both sides moving up together, or both down, is what a healthy market looks like, and it is exactly what closes an open band. A move too small to clear either threshold does nothing either, so an open band is never cancelled by noise.
Nothing is drawn against a candle and nothing sits at a price level. A shape placed on a bar is read as an entry whatever the description says, and this indicator produces no entries.
READING THE PANE
Horizontal is a level and is drawn in neutral grey: dotted lines at 80 and 20, dashed at the halfway mark, soft shading in the two extreme regions. Vertical is an event in time and owns the colour, so a coloured column always means the same thing.
HOW IT IS BUILT
Each member is requested on the selected timeframe with lookahead disabled, and its moving average is computed inside its own context, on its own data. Both readings a member contributes come back as one tuple, so the basket costs one request per symbol rather than two.
Three details decide whether a breadth reading is honest or decorative. A member that has not returned data contributes nothing: it leaves both sides of the division rather than being counted as a coin below its average, because counting silence as weakness is the usual way these readings drift toward zero for reasons unrelated to the market. No share is published at all until a minimum number of members have answered, since a percentage built on three coins is noise wearing the clothes of a statistic. And the cumulative count is detrended before it is drawn, because stretching a raw cumulative line between the extremes of a window pins it against one edge and flattens the recent swing into a thread.
THE SETTINGS
Core. Basket Timeframe, empty follows the chart and higher keeps a slow reading on a fast chart. MA Length, 200 for a long term reading and 50 for a swing one. MA Type across SMA, EMA, WMA and RMA. Coins Counted, how many of the twenty slots take part. Minimum Live Feeds, the smallest sample that may be published at all.
Basket. Twenty symbol slots. Any symbol your plan can open works and the basket does not have to be crypto, so the same engine measures a sector, an index or a watchlist.
Divergence. Reference Symbol, Comparison Window, Reference Move percent and Breadth Gap Points, the two thresholds that define an event.
Visuals. The second line and its swing window; how events are drawn, as line and band, band only, line only or glyph only; the arrow on the edge; on chart explanations and how many are kept; whether events show in the pane, on the chart or both; four colours.
Dashboard. Table on or off, its corner out of eight, and the text size.
THE TABLE, ROW BY ROW
Above MA. The share, with the regime named: broad, healthy, narrow or washed out. Reads warming up while the sample is too small.
Coins. How many members are above their average out of how many actually answered.
Advancing. Up against down on the last bar, the input to the cumulative line.
Cum A/D. The untouched cumulative count, since the plotted line is normalised and says nothing about level.
Reference. What the reference symbol did on the last bar.
Divergence. Direction of the last event, how many bars ago, and whether it is still open.
Event Gap. The two measurements that produced it, for example ref plus 2.5 percent against breadth minus 15 points.
Feeds. How many slots answered and on what timeframe. Turns red when a slot is silent.
The same engine on Ethereum, four hours. The basket does not change with the chart, so the reading is about the market rather than the instrument in front of you.
TIMEFRAMES AND LIMITS
H1 and above. On H1 the lines work but divergences almost never fire, because a genuine disagreement between a whole basket and Bitcoin inside a day is rare. Divergence is a 4h and daily tool.
Members are read through the chart, so their history begins where the chart history begins. A 200 length average needs 200 chart bars before the first reading exists; scroll left to load more or shorten the length.
TradingView allows 40 unique data requests per script and 127 tuple elements. This script spends 21 requests and 42 elements. All 20 slots are requested whatever the counted number is, because requests are fixed at compile time, so lowering it changes the statistic and not the load.
WHAT IT IS NOT
Breadth describes the crowd, not the next bar. A thin market can stay thin for weeks while price grinds higher on two names, and a disagreement can run far longer than a position survives. Low participation is not a reason to short on its own.
Advance decline counting and participation measures are classic market internals from the stock market and belong to nobody. The implementation here is original: the per member context calculation, the exclusion rules, the minimum sample gate, the detrended cumulative and the paired open and close events are what the code actually is. Nothing was reused from another script.
Source link
Author

- Ytv Market News
- Share-market news writer and analyst with deep experience covering equities, commodities, forex, and cryptocurrencies for readers in the USA, UK, Canada, and Australia. Ytv Market News delivers timely market updates, practical trading insights, and clear explanations of macro and company-level catalysts that move prices. Combines on-the-ground financial reporting with technical analysis, using concise charts and actionable ideas to help investors and traders make smarter decisions.
Latest entries
 Company Press ReleasesAugust 25, 2026Norway places order for Patria 6×6 vehicles under the multinational CAVS programme
 Company NewsAugust 25, 2026Die Geberit-Aktie behauptet sich nach starkem Halbjahr im SMI-Umfeld
 Crypto NewsAugust 25, 2026XRP Shatters 5-Year August Record: Bollinger Bands Highlight $1.14 as Ultimate Entry
 Stock Market VideosAugust 25, 2026‘Economic Isolation’ Plan for Iran, Farage Wins UK Election | The Opening Trade 8/14/2026

