

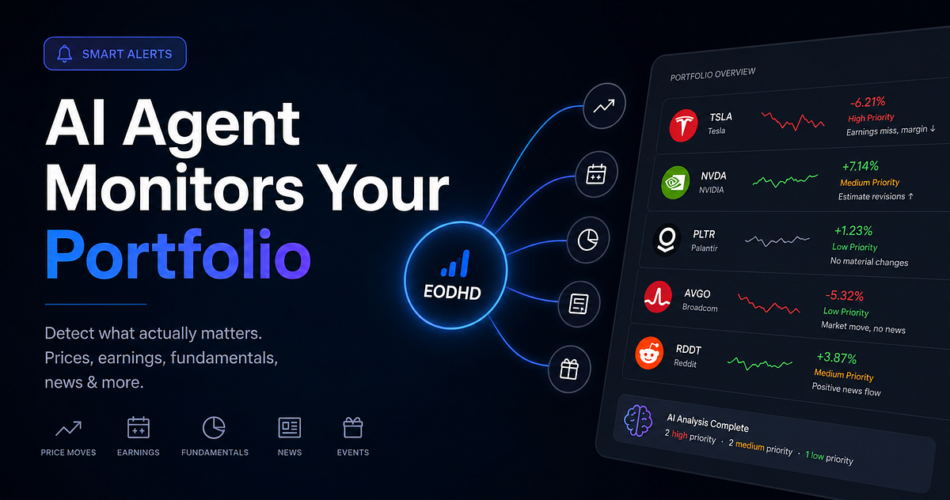

I don’t need another portfolio dashboard.
I already know where to find stock prices, charts, P/E ratios, earnings dates, and financial statements.
The problem isn’t access to information.
It’s knowing when something actually matters.
If Tesla drops 2%, I probably don’t need an alert.
If Tesla drops 8% after disappointing earnings, declining margins, and negative company-specific news, that’s different.
So I decided to build something more useful:
An AI agent that monitors my portfolio and tells me when something meaningful changes.
For this experiment, I’ll monitor five well-known growth stocks:
- Palantir (PLTR)
- Tesla (TSLA)
- Broadcom (AVGO)
- Reddit (RDDT)
- NVIDIA (NVDA)
The goal isn’t to predict tomorrow’s stock price.
The goal is to answer a much more useful question:
Did anything happen today that deserves my attention?
Let’s build it with Python, AI, and real financial data from EODHD.
What the Agent Will Monitor
I decided to focus on five events:
- Unusual price movements
- Earnings and earnings surprises
- Fundamental changes
- Important news and sentiment
- Corporate events
The architecture is simple:
Portfolio
   ↓
EODHD APIs
   ↓
Python
   ↓
Detect Changes
   ↓
Build Context
   ↓
AI Relevance Filter
   ↓
IGNORE / REVIEW / IMPORTANT
   ↓
Daily Portfolio Report
There’s an important distinction here.
Python detects what changed.
AI helps explain whether the combination of those changes deserves attention.
The AI model isn’t allowed to decide whether I should buy or sell the stock.
Setting Up the Project
First, install the dependencies:
pip install requests python-dotenv anthropic
Then create a .env file:
EODHD_API_KEY=your_eodhd_api_key
ANTHROPIC_API_KEY=your_anthropic_api_key
Never hardcode production API keys directly into your Python script.
Now we can define our portfolio:
PORTFOLIO = {
    "PLTR.US": "Palantir",
    "TSLA.US": "Tesla",
    "AVGO.US": "Broadcom",
    "RDDT.US": "Reddit",
    "NVDA.US": "NVIDIA",
}
For the financial data layer, I’m using EODHD.
It gives us access to historical prices, fundamentals, earnings calendars, earnings trends, financial news, sentiment, dividends, and other corporate data from the same API ecosystem.
If you want to reproduce the project, you can get access here:
Get access to EODHD Financial APIs
Creating Our EODHD Client
Instead of scattering API requests throughout the project, I prefer creating one reusable function.
import os
import requests
from dotenv import load_dotenv
load_dotenv()
EODHD_API_KEY = os.getenv("EODHD_API_KEY")
BASE_URL = "https://eodhd.com/api"
def eodhd_get(endpoint, params=None):
    if not EODHD_API_KEY:
        raise ValueError("EODHD_API_KEY is missing")
    params = params or {}
    params["api_token"] = EODHD_API_KEY
    params["fmt"] = "json"
    response = requests.get(
        f"{BASE_URL}/{endpoint}",
        params=params,
        timeout=30,
    )
    response.raise_for_status()
    return response.json()
Now every request becomes much cleaner.
For example:
data = eodhd_get(
    "eod/TSLA.US",
    {
        "order": "d",
        "from": "2026-08-01",
    }
)
Instead of manually building URLs every time, eodhd_get() automatically adds authentication, requests JSON and checks for HTTP errors.
Now we can start building the actual monitoring system.
1. Detecting Unusual Price Movements
The first API we need is the EOD Historical Data API.
For Tesla, the underlying request looks like:
GET /api/eod/TSLA.US
We can request recent data directly from Python:
from datetime import date, timedelta
def get_recent_prices(ticker, days=10):
    start = date.today() - timedelta(days=days)
    return eodhd_get(
        f"eod/{ticker}",
        {
            "from": start.isoformat(),
            "order": "d",
        },
    )
Notice that I’m requesting descending order.
That means the most recent trading session should appear first.
Now we compare the two latest sessions.
def detect_price_event(ticker, threshold=5):
prices = get_recent_prices(ticker)
    if len(prices) < 2:
        return {
            "triggered": False,
            "reason": "Not enough price data",
        }
    latest = prices[0]
    previous = prices[1]
    latest_price = float(latest["adjusted_close"])
    previous_price = float(previous["adjusted_close"])
    change = (
        latest_price / previous_price - 1
    ) * 100
    return {
        "triggered": abs(change) >= threshold,
        "date": latest["date"],
        "price": latest_price,
        "previous_price": previous_price,
        "change_pct": round(change, 2),
    }
Now:
print(detect_price_event("TSLA.US"))
might produce something structurally similar to:
{
    "triggered": True,
    "date": "2026-08-14",
    "price": 400.0,
    "previous_price": 425.0,
    "change_pct": -5.88
}
The values above are illustrative.
The important thing is the logic.
A 5% movement does not mean “sell.”
It means:
Something unusual happened. Investigate.
2. Checking Earnings
Now things get more interesting.
EODHD provides a dedicated earnings calendar endpoint.
We can query several portfolio companies in one request:
def get_earnings(tickers):
return eodhd_get(
        "calendar/earnings",
        {
            "symbols": ",".join(tickers),
        },
    )
For our portfolio:
earnings = get_earnings(PORTFOLIO.keys())
The API can return fields including:
code
report_date
actual
estimate
difference
percent
That last field is particularly useful.
It represents the earnings surprise percentage.
So we can detect unusually large surprises.
def detect_earnings_events(data, threshold=10):
events = []
    for earning in data.get("earnings", []):
        surprise = earning.get("percent")
        if surprise is None:
            continue
        surprise = float(surprise)
        if abs(surprise) >= threshold:
            events.append({
                "ticker": earning["code"],
                "report_date": earning["report_date"],
                "actual": earning.get("actual"),
                "estimate": earning.get("estimate"),
                "surprise_pct": round(surprise, 2),
            })
    return events
Instead of:
Tesla reported earnings.
our system can identify:
TSLA
EPS surprise: -12.4%
That’s much more actionable information.
3. Monitoring Analyst Expectations
This is one of my favorite parts of the system.
EODHD also provides Earnings Trends data.
We can request:
def get_earnings_trends(tickers):
return eodhd_get(
        "calendar/trends",
        {
            "symbols": ",".join(tickers),
        },
    )
This endpoint can provide fields such as:
epsTrendCurrent
epsTrend7daysAgo
epsTrend30daysAgo
epsTrend60daysAgo
epsTrend90daysAgo
epsRevisionsUpLast30days
epsRevisionsDownLast30days
Now we can detect whether expectations are quietly changing before the next earnings release.
For example:
def calculate_estimate_change(current, previous):
if current is None or previous is None:
        return None
    current = float(current)
    previous = float(previous)
    if previous == 0:
        return None
    return (
        current / previous - 1
    ) * 100
Then:
change = calculate_estimate_change(
    trend["epsTrendCurrent"],
    trend["epsTrend30daysAgo"]
)
Imagine the result is:
EPS consensus 30 days ago: 1.25
EPS consensus today: 1.08
Change: -13.6%
The stock might not have moved much yet.
But expectations have.
That’s exactly the kind of change I want my monitor to detect.
4. Pulling Fundamental Data
Next, we retrieve fundamentals.
The real endpoint is:
GET /api/fundamentals/TSLA.US
Our Python function is:
def get_fundamentals(ticker):
return eodhd_get(
        f"fundamentals/{ticker}"
    )
Now:
tesla = get_fundamentals("TSLA.US")
returns a large JSON object containing multiple sections.
For this project, I don’t need everything.
I mainly want Highlights.
def extract_fundamental_snapshot(data):
highlights = data.get("Highlights", {})
    return {
        "revenue_growth_yoy":
            highlights.get("QuarterlyRevenueGrowthYOY"),
        "earnings_growth_yoy":
            highlights.get("QuarterlyEarningsGrowthYOY"),
        "operating_margin_ttm":
            highlights.get("OperatingMarginTTM"),
        "profit_margin":
            highlights.get("ProfitMargin"),
        "revenue_ttm":
            highlights.get("RevenueTTM"),
        "ebitda":
            highlights.get("EBITDA"),
    }
Then:
snapshot = extract_fundamental_snapshot(
    get_fundamentals("TSLA.US")
)
print(snapshot)
This gives us a compact representation of the business instead of passing a massive JSON document into the AI model.
That’s important.
Don’t send everything to the LLM just because you can.
Filter first.
Analyze second.
5. Detecting Fundamental Changes
There’s another important problem.
A single fundamental snapshot doesn’t tell us what changed.
For that, the production version of the agent should persist snapshots.
For example:
data/
    PLTR.US.json
    TSLA.US.json
    AVGO.US.json
    RDDT.US.json
    NVDA.US.json
Every time the agent runs, it compares today’s fundamental snapshot against the previous stored snapshot.
import json
from pathlib import Path
DATA_DIR = Path("data")
DATA_DIR.mkdir(exist_ok=True)
def load_previous_snapshot(ticker):
    file = DATA_DIR / f"{ticker}.json"
    if not file.exists():
        return None
    with open(file, "r") as f:
        return json.load(f)
def save_snapshot(ticker, snapshot):
    file = DATA_DIR / f"{ticker}.json"
    with open(file, "w") as f:
        json.dump(snapshot, f, indent=2)
Then we can compare metrics.
def percent_change(current, previous):
if current is None or previous is None:
        return None
    if previous == 0:
        return None
    return (
        (current - previous) / abs(previous)
    ) * 100
For example:
def compare_fundamentals(current, previous):
if previous is None:
        return {}
    changes = {}
    for metric in current:
        change = percent_change(
            current[metric],
            previous.get(metric)
        )
        if change is not None:
            changes[metric] = round(change, 2)
    return changes
This gives the agent memory.
Without persistence, the system knows:
Tesla’s operating margin is X.
With persistence, it can tell me:
Tesla’s operating margin changed materially since my previous snapshot.
That’s far more useful.
6. Monitoring Financial News
Now let’s check recent news.
EODHD provides a financial news endpoint:
GET /api/news
For an individual company:
def get_recent_news(ticker, limit=10):
return eodhd_get(
        "news",
        {
            "s": ticker,
            "limit": limit,
            "offset": 0,
        },
    )
Then:
news = get_recent_news("NVDA.US")
The important idea isn’t to dump 50 headlines into my report.
It’s to give the AI enough context to determine whether anything meaningful happened.
So I reduce the data first.
def prepare_news(news):
prepared = []
    for article in news[:10]:
        prepared.append({
            "date": article.get("date"),
            "title": article.get("title"),
            "content": (
                article.get("content", "")[:800]
            ),
            "sentiment": article.get("sentiment"),
        })
    return prepared
Again:
Filter first. AI second.
7. Adding Sentiment Data
We can also query EODHD’s sentiment endpoint.
def get_sentiment(tickers, start_date, end_date):
eturn eodhd_get(
        "sentiments",
        {
            "s": ",".join(tickers),
            "from": start_date,
            "to": end_date,
        },
    )
This gives us another signal that can complement individual news articles.
I wouldn’t use sentiment alone to make an investment decision.
But it can help the agent understand whether the information environment around a company has changed substantially.
8. Corporate Events
Corporate actions can also matter.
For example:
def get_dividends(ticker, start_date):
return eodhd_get(
        f"div/{ticker}",
        {
            "from": start_date,
        },
    )
The same architecture can later be expanded to stock splits and other corporate events.
For growth stocks like Reddit or Palantir, dividends obviously aren’t the main signal.
But the point is to build a modular architecture.
Each new dataset becomes another detector.
Putting Everything Together
Now we can build a context object for each company.
def build_company_context(ticker):
price = detect_price_event(ticker)
    fundamentals_raw = get_fundamentals(ticker)
    fundamentals = extract_fundamental_snapshot(
        fundamentals_raw
    )
    previous = load_previous_snapshot(ticker)
    fundamental_changes = compare_fundamentals(
        fundamentals,
        previous
    )
    news = prepare_news(
        get_recent_news(ticker)
    )
    context = {
        "ticker": ticker,
        "price_event": price,
        "fundamentals": fundamentals,
        "fundamental_changes": fundamental_changes,
        "recent_news": news,
    }
    save_snapshot(
        ticker,
        fundamentals
    )
    return context
Now:
context = build_company_context("TSLA.US")
produces one structured object containing the information our AI layer actually needs.
Notice what we’re doing.
We’re not asking Claude to retrieve financial data.
We’re giving Claude structured financial data from EODHD and asking it to interpret the combination.
That makes the system much easier to understand and debug.
Adding the AI Relevance Filter
Now comes the AI layer.
import json
from anthropic import Anthropic
client = Anthropic(
    api_key=os.getenv("ANTHROPIC_API_KEY")
)
Our analysis function can look like this:
def analyze_company(context):
prompt = f"""
You are monitoring a long-term equity portfolio.
Your job is NOT to recommend BUY, SELL or HOLD.
Your job is to identify whether something
materially changed that deserves investor attention.
Analyze this data:
{json.dumps(context, indent=2)}
Focus on:
1. Unusual price movements
2. Earnings or estimate changes
3. Fundamental deterioration/improvement
4. Important company-specific news
5. Corporate events
Ignore normal market noise.
Return exactly:
PRIORITY: LOW / MEDIUM / HIGH
WHAT CHANGED:
Maximum 3 bullet points.
WHY IT MATTERS:
Maximum 3 sentences.
WHAT TO REVIEW:
Maximum 2 bullet points.
"""
    message = client.messages.create(
        model="claude-sonnet-4-20250514",
        max_tokens=500,
        messages=[
            {
                "role": "user",
                "content": prompt,
            }
        ],
    )
    return message.content[0].text
The exact model can obviously be changed.
The more important part is the prompt.
I’m explicitly telling the model:
Don’t make the investment decision.
Its job is to filter information.
Running the Entire Portfolio
Now we can monitor all five companies.
def monitor_portfolio():
reports = {}
    for ticker, company in PORTFOLIO.items():
        print(f"Analyzing {company}...")
        try:
            context = build_company_context(
                ticker
            )
            analysis = analyze_company(
                context
            )
            reports[ticker] = analysis
        except Exception as e:
            reports[ticker] = (
                f"ERROR: {str(e)}"
            )
    return reports
Finally:
reports = monitor_portfolio()
for ticker, report in reports.items():
    print("\n")
    print("=" * 60)
    print(ticker)
    print("=" * 60)
    print(report)
And instead of seeing hundreds of data points, I might get something like:
============================================================
TSLA.US
============================================================
PRIORITY: HIGH
WHAT CHANGED:
- Large price movement detected.
- Earnings expectations have deteriorated.
- Recent company news is predominantly negative.
WHY IT MATTERS:
The combination suggests that the price movement
may be related to changing business expectations
rather than normal daily volatility.
WHAT TO REVIEW:
- Latest earnings report.
- Recent EPS estimate revisions.
While another stock could produce:
============================================================
AVGO.US
============================================================
PRIORITY: LOW
WHAT CHANGED:
- Price volatility increased.
- No significant fundamental deterioration detected.
WHY IT MATTERS:
The movement appears more consistent with market
volatility than a major change in the underlying
business.
WHAT TO REVIEW:
- No immediate action required.
That’s exactly what I wanted.
Not more information.
Better prioritization.
Making the Agent Smarter
This is only version one.
The architecture makes it easy to add more detectors later:
Insider transactions
        ↓
Analyst revisions
        ↓
SEC filings
        ↓
Valuation changes
        ↓
Technical indicators
        ↓
Sector performance
        ↓
Macro events
        ↓
AI relevance layer
But I wouldn’t start there.
A useful agent with five good signals is better than an over-engineered agent watching 50 metrics nobody understands.
One Important Limitation
There’s something important to understand about this system.
The agent doesn’t know whether a stock will go up tomorrow.
And neither does the API.
We’re building an information filtering system, not a crystal ball.
AI can also misinterpret financial information.
That’s why I deliberately separate the architecture into:
EODHD
   ↓
Raw financial data
Python
   ↓
Deterministic calculationsAI
   ↓
InterpretationHuman
   ↓
Investment decision
The closer we get to the actual investment decision, the more important human judgment becomes.
Why I Prefer This to Another Portfolio Dashboard
Most dashboards are designed around:
What is my portfolio worth?
This agent is designed around:
Has my investment thesis potentially changed?
Those are completely different problems.
Imagine monitoring 30 companies.
Most days, nothing important happens to 25 of them.
Maybe three experience unusual volatility.
Maybe one reports earnings.
Maybe another has genuinely important news.
Instead of manually checking 30 companies, my attention goes directly to those two.
That’s the value.
Build Your Own Version
EODHD currently provides the APIs needed for the core data layer used in this project, including historical market prices, company fundamentals, earnings calendars and trends, financial news, sentiment and corporate actions.
You can use the same architecture with five stocks or scale it to a much larger watchlist.
Start building with EODHD Financial APIs
The goal isn’t to know everything happening in the market.
It’s to know when something happens that actually deserves your attention.
Frequently Asked Questions
Does this AI agent automatically buy or sell stocks?
No.
And I deliberately designed it that way.
The system retrieves financial data, detects changes and uses AI to prioritize information.
The final investment decision remains with the investor.
Does the code use real financial data?
Yes.
The Python functions call actual EODHD endpoints for historical prices, fundamentals, earnings, earnings trends, financial news, sentiment and corporate actions.
You need an EODHD API key to access the datasets available under your plan.
Can I test it for free?
EODHD provides a demo token for a limited selection of symbols.
Tesla is one of the symbols that can currently be tested with the demo token.
For the complete portfolio used in this project, including PLTR, AVGO, RDDT and NVDA, you should use your own EODHD API token.
Why use AI if Python already detects the changes?
Because they’re solving different problems.
Python is excellent at deterministic rules:
Price change > 5%
EPS surprise < -10%
Margin declined
EPS estimates declined
But investors usually care about the relationship between those events.
The AI layer can analyze several signals together and produce a concise explanation of why the combination might deserve attention.
Why not let Claude retrieve all the financial data itself?
I prefer separating data retrieval from interpretation.
EODHD provides the structured financial data.
Python performs deterministic calculations.
Claude receives a controlled set of information and interprets it.
That architecture is easier to audit, test and debug.
How often should the agent run?
For a long-term portfolio, I don’t think this needs to run every minute.
Once after the US market closes is enough for many investors.
You could schedule the Python script with cron, GitHub Actions, a cloud function or an automation platform.
Could I monitor 100 stocks instead of five?
Yes.
The architecture doesn’t fundamentally change.
However, API usage, LLM costs and noise increase with the number of companies.
A better architecture at larger scale is to run cheap deterministic filters first and only send interesting companies to the AI model.
In other words:
100 stocks
    ↓
Python filters
    ↓
8 unusual companies
    ↓
AI analysis
    ↓
2 important alerts
That’s much more efficient than asking an LLM to deeply analyze all 100 companies every day.
Can I add Telegram or email alerts?
Yes.
The monitor_portfolio() output can easily become the input to Telegram, Slack, Discord or an email service.
You could even configure the system so that HIGH priority events trigger an immediate notification while LOW priority events only appear in the daily report.
Is this financial advice?
No.
This project is an example of how financial APIs, Python and AI can be combined to organize and analyze information.
The agent can still make mistakes, miss context or incorrectly interpret data.
Use it as a research tool, not as an autonomous investment advisor.
Building something with financial data?
If you’re an API or fintech company looking to explain your product through practical, code-first content instead of marketing fluff, I write pieces exactly like this one.
→ See more of my work
Looking for technical content for your company? I can help — LinkedIn · kevinmenesesgonzalez@gmail.com
