

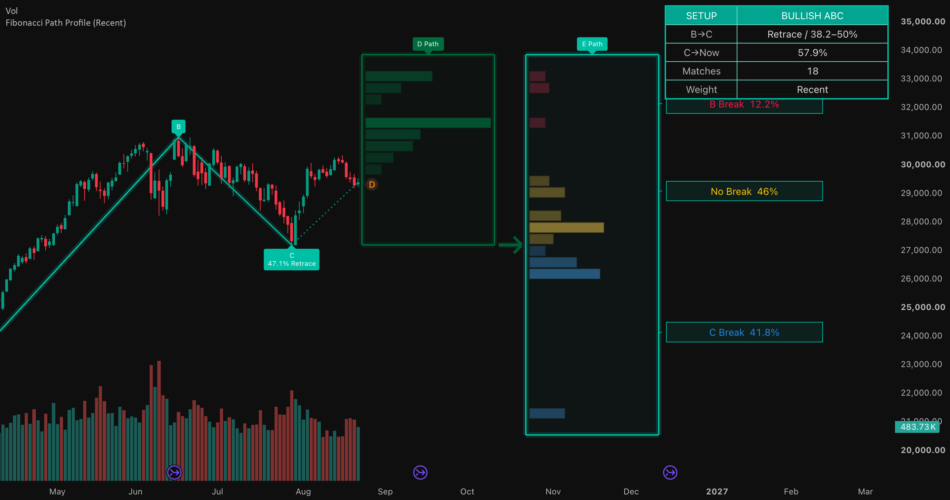
The indicator combines the current A→B impulse, B→C retracement or extension, and live C→Now progress to continuously refine the historical sample.
🟢 ABC STRUCTURE
The indicator automatically detects alternating swing highs and swing lows and organizes them into an A-B-C structure.
Bullish ABC
A→B = upward impulse
B→C = downward retracement
The next D swing develops upward from C
Bearish ABC
A→B = downward impulse
B→C = upward retracement
The next D swing develops downward from C
A→B is used as the base swing for all subsequent Fibonacci measurements.
🟢 FIBONACCI MATCHING
The B→C movement is measured relative to the A→B impulse:
B→C Ratio = |B − C”https://www.tradingview.com/”A − B|
Historical cases are matched using:
Bullish or Bearish ABC direction
B→C Fibonacci range
Live C→Now progress
The B→C ranges are:
0–23.6%
23.6–38.2%
38.2–50%
50–61.8%
61.8–78.6%
78.6–100%
100–127.2%
127.2–161.8%
161.8%+
Up to 100% is classified as a Retrace, while values above 100% are classified as an Extension.
* To preserve a usable historical sample, all B→C values above 161.8% are grouped into a single 161.8%+ matching range rather than being divided into additional extension classes.
🟢 LIVE C→NOW MATCHING
The indicator also measures how far the active move has progressed from C relative to the B→C range.
C→Now = current progress from C relative to |B − C|
As price develops, this progress is used to filter historical cases that remained valid through a similar stage of the move.
🟢 D & E PATH
The profiles show the historical locations of the next two swing points:
D PathDistribution of the next swing point after C.
E PathDistribution of the following swing point after D.
Both D and E locations are normalized relative to the B→C range, allowing historical structures of different absolute sizes to be compared on the same basis.
The E Path is also separated into three structural outcomes:
🟥 B Break — E moves beyond the B level
🟨 No Break — E remains between B and C
🟦 C Break — E moves beyond the C level
The displayed percentages represent the weighted share of each outcome among the currently matched historical cases.
* For the D and E profiles, values beyond the displayed ±161.8% range are grouped into the outermost top or bottom bin rather than split into additional bins.
🟢 REAL-TIME PROFILE
The active profile is continuously recalculated as price develops.
This can update:
C→Now progress
matched historical cases
D Path distribution
E Path distribution
B Break / No Break / C Break probabilities
Because D and E represent the active forward path, both profile boxes are always displayed to the right of the current candle.
🟢 DYNAMIC C
Before a new D swing is confirmed, the B→C retracement may continue to a new extreme.
In that case, the active C point is updated:
Bullish ABC → C moves to a new lower low
Bearish ABC → C moves to a new higher high
This prevents an unfinished B→C leg from being treated as a completed swing.
🟢 WEIGHT
Two weighting methods are available:
Recent
More recent historical cases receive greater weight.
Weight = 1 / (1 + Age / 1500)
where Age is measured in bars.
Equal
Every matched historical case receives the same weight.
Use Recent to emphasize newer market behavior or Equal to view the unweighted historical distribution.
🟢 HOW TO USE
Use the indicator to evaluate how similar historical structures developed from the current setup.
D Path highlights where the next swing historically tended to form.
E Path shows how price developed after that D swing.
B Break / No Break / C Break summarizes the historical structural outcome.
C→Now continuously refines the sample as the active move progresses.
The profiles represent historical swing distributions, not traded volume.
They are designed to provide a probabilistic view of the active structure rather than a fixed Fibonacci price target.
🟢 DISCLAIMER
This indicator is provided for informational and educational purposes only and does not constitute financial or investment advice.
Historical patterns and probabilities do not guarantee future results. All trading and investment decisions remain the sole responsibility of the user.
Source link
Author

- Ytv Market News
- Share-market news writer and analyst with deep experience covering equities, commodities, forex, and cryptocurrencies for readers in the USA, UK, Canada, and Australia. Ytv Market News delivers timely market updates, practical trading insights, and clear explanations of macro and company-level catalysts that move prices. Combines on-the-ground financial reporting with technical analysis, using concise charts and actionable ideas to help investors and traders make smarter decisions.
Latest entries
 UsaAugust 24, 2026$UNH stock fell 3% this week. Here’s what we see in our data.
 Crypto NewsAugust 24, 2026Jupiter is Predicted to Drop to $ 0.155608 By Aug 28, 2026
 Investing InsightsAugust 24, 2026Altcoin Market Adds $215 Billion in Three Days, But True Altseason Remains Unconfirmed — BigGo Finance
 GermanyAugust 24, 2026Shein’s pursuit of an IPO: From New York to London to Hong Kong


