

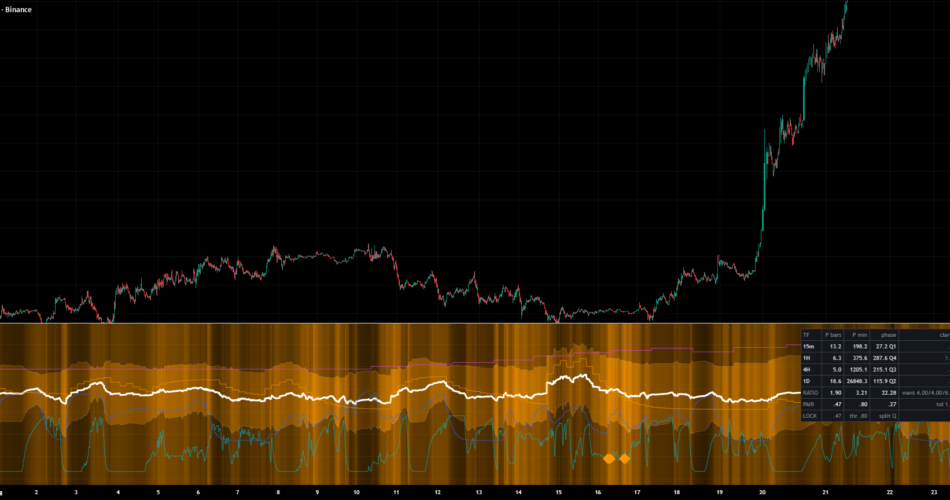
WHAT IT DOES
Inside each of four timeframes (15m, 1H, 4H, 1D by default) it detrends price against a 120-bar moving average and runs a causal autocorrelation scan over lags 5 to 60, taking the first local peak above zero as that timeframe’s dominant cycle period. The period is smoothed, converted to minutes, and plotted as a log-period line, so four timeframes measured in different units land on one comparable axis. The white line is the weighted mean of those log-periods and the grey band their weighted dispersion.
The lock test asks whether the four periods sit in the expected nested ratios – each timeframe’s cycle roughly four, then four, then six times longer in wall-clock than the one below it. Each pair gets an exponential penalty on its log-ratio error, and the three are combined as a geometric mean. When that score clears the threshold and all four cycle phases sit in the same 90-degree quadrant, the pane marks a resonance diamond. The audit table prints every period in bars and in minutes, every phase and quadrant, the autocorrelation clarity behind each estimate, the three realised ratios against the expected ones, and the pair scores.
THE ERROR THIS VERSION FIXES
The lock score could not reach its own threshold. Not rarely – never, on any instrument, on any timeframe.
The three pair tests compared period counts in BARS while the expected ratios 4/4/6 describe wall-clock nesting. Because every leg searches the same 5-to-60 lag window in its own bars, the timeframe scaling silently divided out: the product of the three ratio terms reduced to P_1d / (96 x P_15), which the lag clamp caps at 60 / (96 x 5) = 0.125. That puts a ceiling of exp(-ln 8 / 1.5) = 0.25 on the lock score against a threshold of 0.80. An exhaustive search over all 9,834,496 integer-period combinations the estimator can produce confirms the maximum is exactly 0.2500. Measured on real data the score never got near even that: it peaked at 0.113 on BINANCE:BTCUSDT 15m and 0.200 on ETHUSDT over 6,000 bars each, so the diamond never drew and the alert never fired.
The fix is to compare in minutes, where 4/4/6 means what the header always claimed. With the default timeframes that is algebraically the same as asking whether the four legs agree on a bar count, and it is now satisfiable. The tolerance default also moved from 0.5 to 1.0, because at 0.5 the repaired score reaches 0.99 but never on a bar where all four phases share a quadrant, so the resonance state stayed empty on BTCUSDT.
WHAT IT DOES AFTER THE FIX, MEASURED
Over 5,757 scored bars of BINANCE:BTCUSDT 15m at the new defaults, the lock score has a median of 0.416, a 95th percentile of 0.667 and a maximum of 0.995. Sixty-two bars clear the 0.80 threshold; all four phases share a quadrant on 543 bars; both conditions hold together on 10 bars, which is 0.17% of them. On ETHUSDT over the same window: median 0.434, maximum 0.928, 67 bars over threshold, 1,302 same-quadrant bars, and 55 resonance bars, or 0.96%.
The background shading is also visible now, which it was not before. It is driven by the lock score, and with the score capped at 0.11 the shading sat at 99% transparency on 41% of bars and never got below 92%.
WHAT THE SCALE ACTUALLY SAYS
Worth knowing before reading anything into a lock. Every leg searches the same 5-to-60 lag window in its own bars, so the periods come out near-identical in bar counts across the four timeframes – medians of 14.6, 14.2 and 14.1 bars on BTCUSDT 15m. In minutes that is close to the nested structure the lock test looks for, which means part of the agreement the score rewards is a property of the shared lag window rather than of the market. The estimator also hits its lower bound often enough to matter.
No edge is claimed and none was measured. There is no forward-return figure here and no suggestion that a resonance diamond predicts anything.
HOW THE NUMBERS WERE CHECKED
The whole computation – detrending, the autocorrelation scan with its first-peak rule, the EMA smoothing, the phase estimate, the weighting and the lock score – was reimplemented outside Pine and cross-checked against this chart’s Data Window: eight quantities on ten bars, all agreeing to the four decimals TradingView prints, with a worst raw difference of 4.9e-5 which is the display’s own rounding floor.
The check discriminates. Changing the period smoothing from 5 to 4 breaks 65 of the 80 values; changing the autocorrelation window from 60 to 59 breaks 64; reading the higher timeframes in developing rather than confirmed mode breaks 35 with errors four orders of magnitude above the tolerance.
One honest limit on that validation: the resonance path could not be verified against TradingView, because at the old defaults it never fired anywhere. The phase, quadrant and lock-score code is implemented directly from the source and produces sane values, but the only live confirmation of the repaired state is on this chart, not from the original capture.
SETTINGS AND WARM-UP
Each leg needs 242 bars of its own timeframe before it returns anything, so the daily leg needs 242 daily bars of history behind the chart. The four higher-timeframe reads use lookahead together with a one-bar shift inside the requested context, which is the non-repainting idiom: what arrives is the last fully closed bar of that timeframe. Switching the HTF data mode to Developing removes that shift and the values then change until the higher-timeframe bar closes.
The four attention weights are normalized, so only their ratios matter – but they own the plotted shape: driving the profile onto a single timeframe moves the weighted centre line by 3.5 log units, a 33-fold change in the implied period.
WHAT ELSE CHANGED IN THIS VERSION
The audit table that the settings already promised did not exist – its five helper functions were written and left unused – and it is now implemented, including a ratio row that shows the realised minute-domain ratios next to the expected ones. An MPL header was added and a leftover compile-sentinel plot removed. An unexplained lineage note in the header was deleted.
Open source under MPL 2.0. Nothing here is a forecast, a signal service, or a claim of profitability.
Source link
Author

- Ytv Market News
- Share-market news writer and analyst with deep experience covering equities, commodities, forex, and cryptocurrencies for readers in the USA, UK, Canada, and Australia. Ytv Market News delivers timely market updates, practical trading insights, and clear explanations of macro and company-level catalysts that move prices. Combines on-the-ground financial reporting with technical analysis, using concise charts and actionable ideas to help investors and traders make smarter decisions.
Latest entries
 Crypto NewsAugust 24, 2026Pi Network holds key support amid Testnet’s upgrade to Protocol 27
 CanadaAugust 24, 2026Canadian Investment Regulatory Organization Trade Resumption
 Trading IndicatorsAugust 24, 2026Elder SafeZone Stop | Trading Indicator
 Trading IndicatorsAugust 24, 2026MTF Hilbert Quadrature Phase-Lock [FibonacciFlux] — Indicator by FibonacciFlux — TradingView


