

WHAT IT MARKS
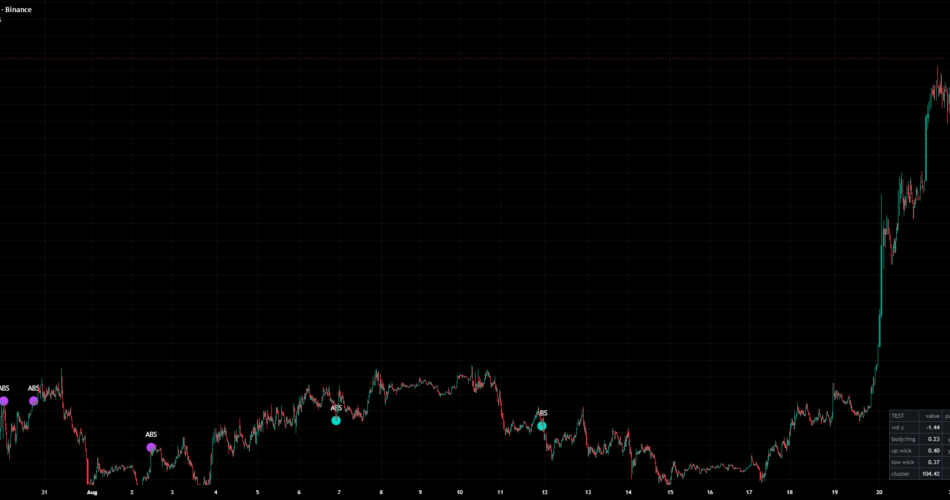
A bar is marked when four things are true at once: volume is at least 1.8 standard deviations above its 50-bar mean, the body is at most 36% of the bar’s range, one wick is at least 38% of it, and the bar is revisiting a level it already reacted to – within 0.28 ATR of the 18-bar extreme on that side. Sell marks sit at the high, buy marks at the low. An audit table shows each of those four quantities for the last bar and whether it passed, so the reason for a mark, or for its absence, is visible rather than implied.
Real absorption is an order-book event. Nothing in OHLCV can see resting size, and this script does not pretend otherwise: it marks a shape.
HOW OFTEN, AND WHERE
At default inputs, on the 6000 bars of BINANCE:BTCUSDT 15m ending 2026-08-18 13:00 UTC – 62 days – it marks 16 bars: 0.27% of them, 9 sell and 7 buy, no two closer than 26 bars apart, and no bar ever firing both sides.
That rate belongs to the symbol and the bar size, not to the indicator. Same defaults, same measurement: BTCUSDT 1h 0.57%, BTCUSDT 4h 0.50%, ETHUSDT 15m 0.32%, ETHUSDT 1h 0.30%. On daily bars it can go a very long time without marking anything – on BTCUSDT 1D it marked nothing at all across 1000 days. It is built for intraday bars, and that is a limit rather than a preference.
WHAT THE MEASUREMENT DOES NOT SUPPORT
The tempting reading of a script like this is that the four gates recognise one event together – that a volume spike means something different on an absorption-shaped bar than on any other bar. Measured, that is not visible here.
Over the 5,951 scored bars, a volume spike is no more likely on a bar that already passed the shape and level tests than on any other bar: the lift is 0.99x on the sell side (95% CI 0.53 to 1.80) and 0.75x on the buy side (CI 0.36 to 1.45). With 123 sell candidates, an interaction smaller than roughly 1.6x could not be seen at all, so the honest statement is that the joint structure is undemonstrated at this sample size, not that it has been disproved.
A second test points the same way. Circularly shifting the volume series against untouched candles – which destroys any alignment between volume and bar shape while preserving both series’ own distributions – produces about 19 marks on average (5th to 95th percentile 12 to 26) where the real series produces 16. The real series sits below its own null rather than above it, though not significantly (two-sided p = 0.59). One plausible mechanism, measured: range and volume correlate at 0.69, so genuinely high-volume bars tend to be wide-range bars, and wide-range bars are exactly what the small-body gate throws away.
The level gate is the part that surprised me most. At the shipped 18-bar lookback, a bar sitting at an 18-bar extreme is about 28% LESS likely to carry a volume spike than a bar that is not (0.72x, 95% CI 0.48 to 0.96 on BTCUSDT 15m; 0.62x on ETHUSDT 15m). The relationship does turn positive at longer lookbacks – around 60 bars it runs between 1.3x and 2.5x across BTC and ETH on 15m and 1h – but the headline BTCUSDT 15m cell does not separate from a volume-shift null even there. The default is left at 18 because every number quoted here was measured at it, and the tooltip on that input says all of the above.
Two more things a user should know before turning knobs. “Require Same Price Reaction” is what makes the indicator rare: switching it off takes the same 6000 bars from 16 marks to 147, and it also silently disables the three inputs above it, which do nothing whatsoever while it is off. And the volume threshold’s default of 1.8 sits in the middle of a flat plateau – every value from 1.7 to 2.2 produces exactly the same 16 marks – so nudging it one step will usually appear to do nothing.
No edge is claimed and none was measured. There is no forward-return figure here, no hit rate, and no suggestion that a mark predicts anything.
HOW THE NUMBERS WERE CHECKED
The whole computation was reimplemented outside Pine and cross-checked against this chart’s Data Window on five bars chosen in advance – three sell marks, one buy mark, and one bar that fires nothing so that a model marking everything could not pass. All five agree exactly, to the price rather than to a tolerance. The reimplementation then reproduces the entire firing set independently: the same 16 bars, at the same indices, over the same 6000.
WHAT CHANGED IN THIS VERSION
The previous version declared a compact volume profile – six inputs, three colour pickers, box and line arrays and a colour helper – and drew none of it: the file simply ended before that code existed. Shipping inputs that do nothing is the thing this publication is trying not to do, so the profile is gone and the title no longer claims one. What remains is the absorption test, which is complete and testable, plus an MPL header, the audit table, and a clamp on “Max Body / Range” so that the part of its slider that could never matter stops pretending it does.
Open source under MPL 2.0. Nothing here is a forecast, a signal service, or a claim of profitability.
Source link
Author

- Ytv Market News
- Share-market news writer and analyst with deep experience covering equities, commodities, forex, and cryptocurrencies for readers in the USA, UK, Canada, and Australia. Ytv Market News delivers timely market updates, practical trading insights, and clear explanations of macro and company-level catalysts that move prices. Combines on-the-ground financial reporting with technical analysis, using concise charts and actionable ideas to help investors and traders make smarter decisions.
Latest entries
 Crypto NewsAugust 24, 2026Donald Trump Sold MicroStrategy and Bought Two Other Crypto Stocks
 Investing InsightsAugust 24, 2026Hong Kong Banks Begin Verification of Dormant Mainland Investor Accounts; Over 20% of Accounts May Face Investment Function Suspension
 GermanyAugust 24, 2026Norway will drill in Arctic regardless of EU’s position, says energy minister
 Crypto NewsAugust 24, 2026Bitcoin Meets Banking As Saylor Pushes A Sovereignty Vision


