

Fibonacci retracement is one of the most widely used tools in trading. It is also one of the least verified. “The 0.618 is the golden pocket” gets repeated everywhere and tested nowhere. This script keeps score — not universally, but specifically for the chart you are actually looking at.
✨ WHY THIS IS DIFFERENT
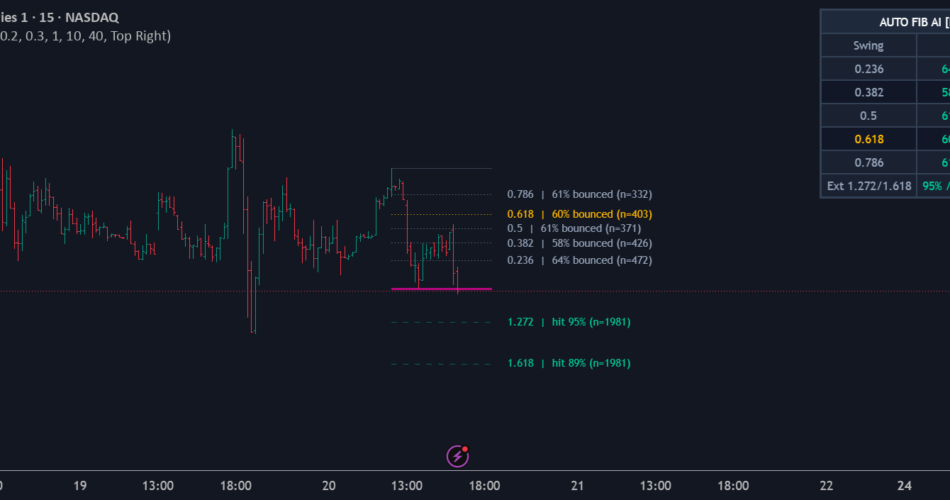
Every other Fibonacci tool draws the levels and stops there. Whether those levels actually work on this instrument, this timeframe, this market condition is left entirely to assumption. This script treats that as a question worth answering. Every touch of every level is graded: did price reject cleanly, or push through? The results accumulate directly in each level’s label:
📊 0.618 | 71% bounced (n=24)
That means: on this chart, at this timeframe, price has touched the 0.618 level 24 times across all the swings this script has processed. 71% of those touches resulted in a genuine rejection. 29% broke through. That is a real measurement, not a theoretical assumption.
⚙️ HOW IT WORKS
📐 Auto swing detection — the script identifies the most recent confirmed pivot high and pivot low using a configurable lookback. A minimum swing size filter (in ATR units) rejects small, noisy movements — only swings that represent genuine market structure anchor the Fibonacci grid. Swings are confirmed only on closed bars, so the anchor never changes retroactively.
📏 Retracement levels — the standard five levels are drawn from the detected swing: 0.236, 0.382, 0.500, 0.618, and 0.786. The 0.618 is highlighted in amber since it receives the most attention from traders and institutions. Each level accumulates its own separate statistics.
🎯 Touch grading — every time price approaches a level within a configurable tolerance, a touch is recorded and enters a pending state. Within the outcome window (configurable bars), it resolves as one of three outcomes:
• Bounce — price moved cleanly away from the level without breaking it
• Break — price closed convincingly through the level
• Timeout — neither happened clearly enough to call; counted as a touch but not a bounce or break
Each resolved touch feeds into that level’s cumulative percentage — and the labels update to show the live result.
🟢 Extension targets — when price breaks past the swing’s extreme (not just retracing to it but genuinely continuing through), the script activates two extension targets: 1.272 and 1.618. These are the levels most commonly used as continuation targets after a structural break. Each is tracked in its own way: did price actually reach 1.272 after the break? 1.618? Over time, the extension labels show:
📊 1.272 | hit 64% (n=11)
📊 1.618 | hit 41% (n=11)
That’s a concrete answer to “how far does price usually go when it breaks the swing?” — specific to this chart, not assumed from theory.
🔒 Non-repainting — pivots only confirm after the required bars on each side have closed. The swing anchor only updates when a new qualifying pivot is confirmed. Grading only happens on confirmed bars. The levels and statistics reflect what actually happened, not what the current bar is doing in real time.
🧭 HOW TO USE
1️⃣ Let the sample size build before trusting the percentages. A level that shows “0% bounced (n=2)” is meaningless — two touches is noise. The labels deliberately show the N= count so you can judge reliability yourself. A consistent reading across 15+ touches is worth paying attention to; 3-5 touches is still developing.
2️⃣ Compare across levels. If 0.382 shows 40% bounced on this chart while 0.618 shows 74% bounced, that’s telling you something specific about which pullback depth this market tends to respect. That difference is invisible to a plain Fibonacci tool.
3️⃣ Use extension hit rates for target selection. If 1.272 has been reached in 64% of breakout cases but 1.618 only in 41%, the first extension is the more realistic target on this chart — and the second, while possible, has historically been hit less than half the time. This is not a rule; it is an observation about past behavior on this specific chart.
4️⃣ Adjust settings to the timeframe. The defaults (pivot leg 8, minimum swing 3× ATR) are calibrated for mid-range timeframes — 15-minute through 4-hour — where Fibonacci retracement is most actively watched by swing traders and where enough swings complete regularly to build meaningful sample counts. On faster timeframes, reduce both settings so smaller swings qualify. On slower ones, increase them to filter noise.
5️⃣ The statistics describe the past, not the future. A high bounce rate at 0.618 means price has historically respected this level on this chart. It is not a promise that the current touch will also bounce. Use the percentages as context — one input among many — not as an automatic signal.
🛠️ SETTINGS
📐 Swing Detection
• Pivot Leg — bars required on each side to confirm a swing pivot
• Min Swing Size — smallest qualifying swing in ATR units; filters out noise
🎯 Level Grading
• Touch Tolerance — how close price must come to a level to count as a touch
• Break Buffer — how far past a level close must clear to grade as a break
• Bounce Distance — how far price must move away, cleanly, to grade as a bounce
• Outcome Window — bars allowed for a touch to resolve
• Extension Window — bars allowed for an extension target to be reached after a break
🎨 Visualization
• Show Extension Targets — toggle the 1.272 / 1.618 green lines
• Per-Level Stat Labels — toggle the bounce-rate text on each level
🖥️ Dashboard
• Show / hide, position — swing direction and per-level bounce rates in a compact table
📝 NOTES
The script tracks one active Fibonacci grid at a time — the most recent qualifying swing. When a new swing confirms, the grid shifts and per-level statistics carry forward from all previous swings on the chart. The statistics are global across all swings processed since the indicator was added to the chart, not per-swing.
Statistics are most meaningful on timeframes where Fibonacci retracement is genuinely watched and defended by real market participants — typically 15-minute through 4-hour. Very short timeframes will accumulate sample counts quickly but the measurements may reflect microstructure noise rather than true level respect. Very long timeframes will take extended real-world time to build enough data to be informative.
⚠️ DISCLAIMER
This is an analytical and visualization tool. It does not generate trade signals and does not constitute financial advice. Historical bounce and hit rates do not guarantee how price will behave at any specific future level touch.
Source link
Author

- Ytv Market News
- Share-market news writer and analyst with deep experience covering equities, commodities, forex, and cryptocurrencies for readers in the USA, UK, Canada, and Australia. Ytv Market News delivers timely market updates, practical trading insights, and clear explanations of macro and company-level catalysts that move prices. Combines on-the-ground financial reporting with technical analysis, using concise charts and actionable ideas to help investors and traders make smarter decisions.
Latest entries
 Investing InsightsAugust 24, 2026Hong Kong Stocks Fall for First Time in 6 Sessions; Alibaba Plunges 8.5% on Dilution Concerns from Massive Capital Raise — BigGo Finance
 GermanyAugust 24, 2026Oil falls ahead of US announcement of new sanctions on Iran
 Crypto NewsAugust 24, 2026Could AI Threaten Bitcoin? Peter Schiff Sounds the Alarm
 Crypto NewsAugust 24, 2026Bitcoin posts its second-best week since 2021 as Dollar weakens


