

How it works
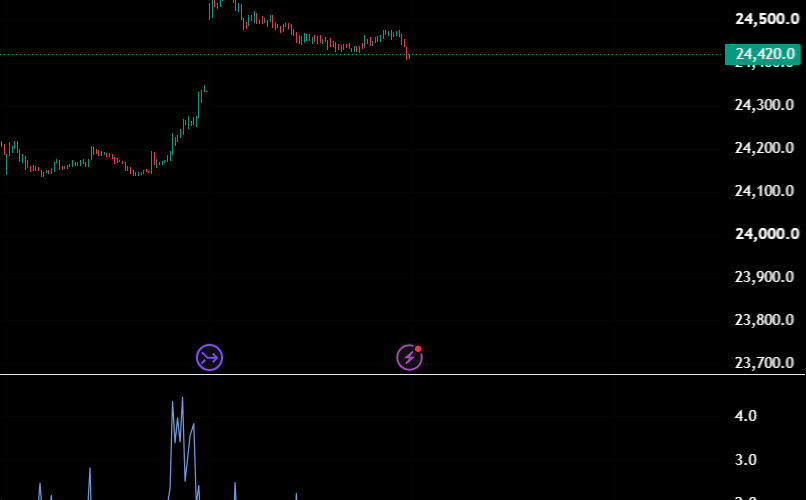
Each bar maps to a wall-clock slot (say every 5 minutes). The library keeps one rolling mean / stdev per slot, updated only when that slot occurs, so “how unusual is now” is always measured against this time of day’s own history. The estimators are exponential — an N-session memory — so there are no large buffers and nothing repaints.
Slot mapping
slotOf(slotMinutes) — the time-of-day slot index for the current bar, from the symbol’s exchange clock ((hour·60 + minute) ÷ slotMinutes). For NSE that’s IST, so it lines up with NIFTY’s 09:15–15:30 session.
slotCount(slotMinutes) — how many slots cover a 24h day at that granularity. Pass it as nSlots to size the per-slot state.
sessionAlpha(sessions) — the EMA weight for an N-session memory (≈ 2 / (N+1)). Feed it to the estimators below.
slotLabel(slot, slotMinutes) — an “HH:MM” label for a slot, for dashboards.
Per-slot baselines
slotMean(src, slot, nSlots, alpha) — the rolling mean of src for this time-of-day slot: the baseline itself.
slotStdev(src, slot, nSlots, alpha) — the rolling dispersion for this slot.
slotZ(src, slot, nSlots, alpha) — the time-of-day z-score, (src − slot mean) ÷ slot stdev, in one call. “How unusual is this bar for this time of day.” The core self-calibrating read — pass volume, range, or any intraday series.
slotRatio(src, slot, nSlots, alpha) — src ÷ slot mean (1.0 = a normal reading for this time of day, 2.0 = twice the usual). Ideal for volume — “heavy for the open”, not “heavy vs a flat average”.
Time-of-day edge ranking
slotHitRate(add, win, slot, nSlots) — per-slot forward-test bookkeeping. When a signal outcome resolves, call with add = true and win = true/false, passing the signal bar’s slot (e.g. slot[horizon]); it returns that slot’s running hit rate (%). Use it to see which parts of the session your signal works in — and which to sit out.
slotCountN(add, slot, nSlots) — the sample count accrued for a slot, so you can weight its hit rate by confidence.
How to use
Make “high volume” mean high for this time of day, and pair it with a time-of-day edge read:
//version=6
indicator(“Example — time-of-day baselines”, overlay = false)
import Market_Logic_India/ml_session/1 as sess
slotMin = input.int(5, “Slot minutes”)
memory = input.int(20, “Session memory”)
n = sess.slotCount(slotMin)
a = sess.sessionAlpha(memory)
sl = sess.slotOf(slotMin)
volRatio = sess.slotRatio(volume, sl, n, a) // volume vs its time-of-day norm
volZ = sess.slotZ(volume, sl, n, a) // standardized for this slot
plot(volRatio, “Vol vs ToD”, color = volRatio > 1.5 ? color.orange : color.gray)
// time-of-day edge (host resolves `win` at its horizon):
// hit = sess.slotHitRate(resolvedNow, win, sl[horizon], n)
Pairs naturally with a VSA / effort-vs-result read: a true “climactic” bar is one whose volume is extreme for its slot, not merely above a flat mean.
Notes
Non-repainting: every read is a pure function of the values you pass and per-slot state that only moves forward. Feed confirmed-bar values (gate on barstate.isconfirmed) and the baselines never look ahead. No ta.* inside, so nothing can short-circuit.
Warm-up: each slot needs a few sessions before its baseline is meaningful; early bars return the seed value or na.
Types: pass series for the source and slot, simple int for nSlots, and simple float for alpha.
The clock is the symbol’s exchange timezone, so it’s correct for NSE without configuration; on a 24h symbol every slot simply fills.
Concept credits
Intraday seasonality — the U-shaped time-of-day profile of volume and volatility — is long established in market-microstructure research. This library is an original, dependency-free Pine v6 packaging of that idea; it is not affiliated with, nor endorsed by, any originator.
License
Mozilla Public License 2.0 — as required for TradingView libraries (open source). Free to import and build on.
Source link
Author

- Ytv Market News
- Share-market news writer and analyst with deep experience covering equities, commodities, forex, and cryptocurrencies for readers in the USA, UK, Canada, and Australia. Ytv Market News delivers timely market updates, practical trading insights, and clear explanations of macro and company-level catalysts that move prices. Combines on-the-ground financial reporting with technical analysis, using concise charts and actionable ideas to help investors and traders make smarter decisions.
Latest entries
 Politics News TodayAugust 27, 2026Trump’s housing affordability push hit by diesel and energy costs
 Forex NewsAugust 27, 2026Japanese Yen : Range holds with BoJ hike expectations – BBH
 IndiaAugust 27, 2026Crude Oil Prices fall as diplomacy eases West Asia supply concerns
 Company Press ReleasesAugust 27, 2026Kustom BidCo AB (publ) publishes half-year report 2026

