

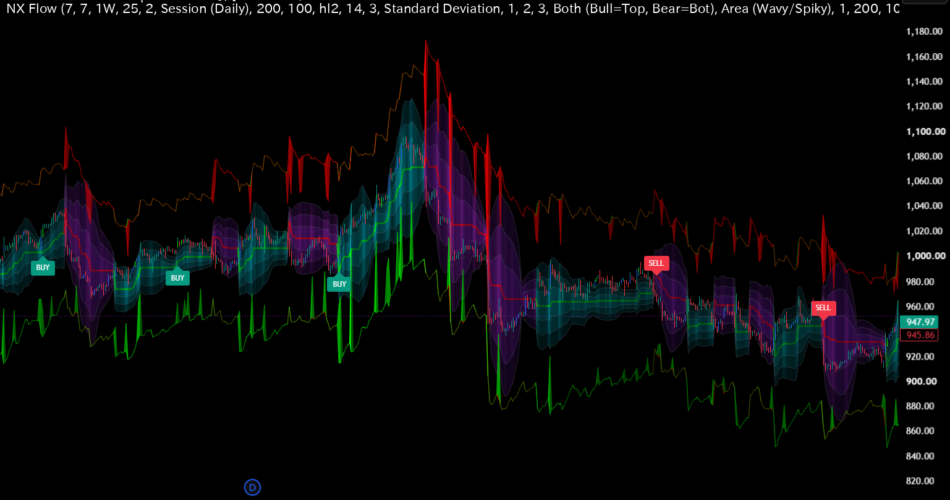
“NX Flow” is a next-generation confluence indicator that seamlessly merges pure Price Action with Order Flow dynamics.
While many traders focus solely on the shape of price movements, it is “Volume” and “Liquidity” that truly drive the market. This script is designed to project the fundamental essence of the market—institutional intent, structural shifts, and true buying/selling pressure—directly onto your main chart intuitively, without cluttering your workspace with complex lower-pane oscillators.
■TradingView House Rules & Educational Intent
This script is built strictly for educational purposes and fully complies with TradingView’s House Rules. It utilizes absolutely NO repainting functions and NO lookahead features that reference future data. To ensure signal authenticity and maintain chart performance, heavy internal calculations (such as Volume Profile processing) are highly optimized and executed only when the candle is finalized (barstate.isconfirmed).
■Core Calculation Logic & Mathematical Rationale
The script mathematically evaluates the following elements. A signal is output only when the combined score exceeds your defined sensitivity threshold.
1. SuperTrend Baseline (Trend & Volatility)
Calculation: Base = hl2. Upper/Lower Bands = Base ± (Multiplier * ATR).
Why? Simple moving averages lag and ignore volatility. By using the median price and ATR, this model dynamically adapts to market noise, tightening during consolidation and widening during high volatility to prevent premature stop-outs.
2. Fibonacci Retracements (0.5 / 0.618)
Calculation: Range = Pivot High – Pivot Low. Dynamically calculates the 50% and 61.8% retracement levels of the most recent swing.
Why? These ratios are statistically proven mean-reversion zones where institutional algorithms frequently place limit orders. Calculating these automatically removes subjective drawing errors.
3. CVD (Cumulative Volume Delta)
Calculation: Delta = +Volume (if Close > Open) or -Volume (if Close < Open). Cumulates the net difference.
Why? Total volume shows activity, but CVD reveals “Intent.” By separating buying/selling volume, it exposes hidden Order Flow, allowing you to spot divergences where smart money is distributing into retail buying pressure.
4. Volume Profile POC (Point of Control)
Calculation: Scans the high/low range over the last 200 bars, divides it into equal bins, and aggregates volume into the specific bin where the typical price (hlc3) traded. Finds the bin with the max volume.
Why? POC is the exact mathematical price where the most trading occurred—the “fairest” value agreed upon by buyers and sellers. It acts as a massive gravitational wall. To keep the chart clean, this is computed strictly via background array logic.
5. FVG (Fair Value Gap) & CHoCH (Change of Character)
Calculation: Detects 3-candle liquidity voids (FVG) and structural breaks of recent pivot highs/lows (CHoCH).
Why? Identifies the exact moment a sequence of highs/lows is broken and visualizes areas of inefficient pricing that the market will naturally seek to rebalance.
6. Smart Bias (MTF & VSA – Volume Spread Analysis)
Calculation: Validates execution timeframe VSA (Spread > 20 SMA & Volume > 1.5x 20 SMA) against the Higher Timeframe (default Weekly) EMA trend.
Why? Eliminates counter-trend fake-outs. If macro trend is bullish, it mathematically filters out micro bearish traps by demanding institutional effort (high volume/spread) aligns with the macro direction.
■Visual Interface: Cyber Volume Envelope
The wavy bands rendered at the top and bottom of the SuperTrend scale the current volume’s strength against its moving average using an ATR multiplier. When volume spikes, the waves expand dynamically. This provides an immediate, intuitive read of the market’s injected energy right on the price action, eliminating the need to look away at a separate volume indicator.
■How to Use
Trend Identification: Assess the immediate market environment using the color of the central SuperTrend line and its surrounding Cyber Bands.
Confluence Signals: A “BUY / SELL” label is triggered only when your required number of conditions (default 5 out of 7) align, combined with strict filters requiring above-average volume and sufficient candle body size.
Customize the Confluence Sensitivity and Higher Timeframe baseline in the settings to perfectly match your trading style.
This indicator and description are provided for educational and informational purposes only and do not constitute financial advice or a recommendation to buy or sell any financial instrument. Trading in financial markets involves a high degree of risk and may result in the loss of your entire capital. The signals and analysis provided by this script are based on historical data and probabilistic modeling, and do not guarantee future profits. The author accepts no liability for any losses or damages incurred as a result of using this script. All trading decisions must be made strictly at your own discretion and at your own risk.
Source link
Author

- Ytv Market News
- Share-market news writer and analyst with deep experience covering equities, commodities, forex, and cryptocurrencies for readers in the USA, UK, Canada, and Australia. Ytv Market News delivers timely market updates, practical trading insights, and clear explanations of macro and company-level catalysts that move prices. Combines on-the-ground financial reporting with technical analysis, using concise charts and actionable ideas to help investors and traders make smarter decisions.
Latest entries
 Politics News TodayAugust 27, 2026Ana Navarro rejects Hunter Biden’s claim that Trump is a dictator
 Market Movers TodayAugust 27, 2026Everpure (NYSE:P) Reports Upbeat Q2 CY2026, Guides for Strong Full-Year Sales
 Forex NewsAugust 27, 2026Taiwan Dollar: Consolidation range with upside risks against US Dollar – Commerzbank
 Company Press ReleasesAugust 27, 2026Swedish company Frost Unmanned signs Commercial Agreement with French Alta Ares regarding Advanced Unmanned Systems

