


Hyperliquid (HYPE) is up 4% on Wednesday, with bulls aiming to advance last week’s 43% gains to a fresh record high above $83.30. The “Everything Exchange” is gaining institutional and user demand, with Exchange Traded Funds (ETFs) recording daily inflows of over $5 million in each of the last two days, while printing daily revenue of over $2.75 million over the last seven days. The technical outlook for HYPE is bullish, with momentum remaining elevated.
Hyperliquid revenue collection heats up
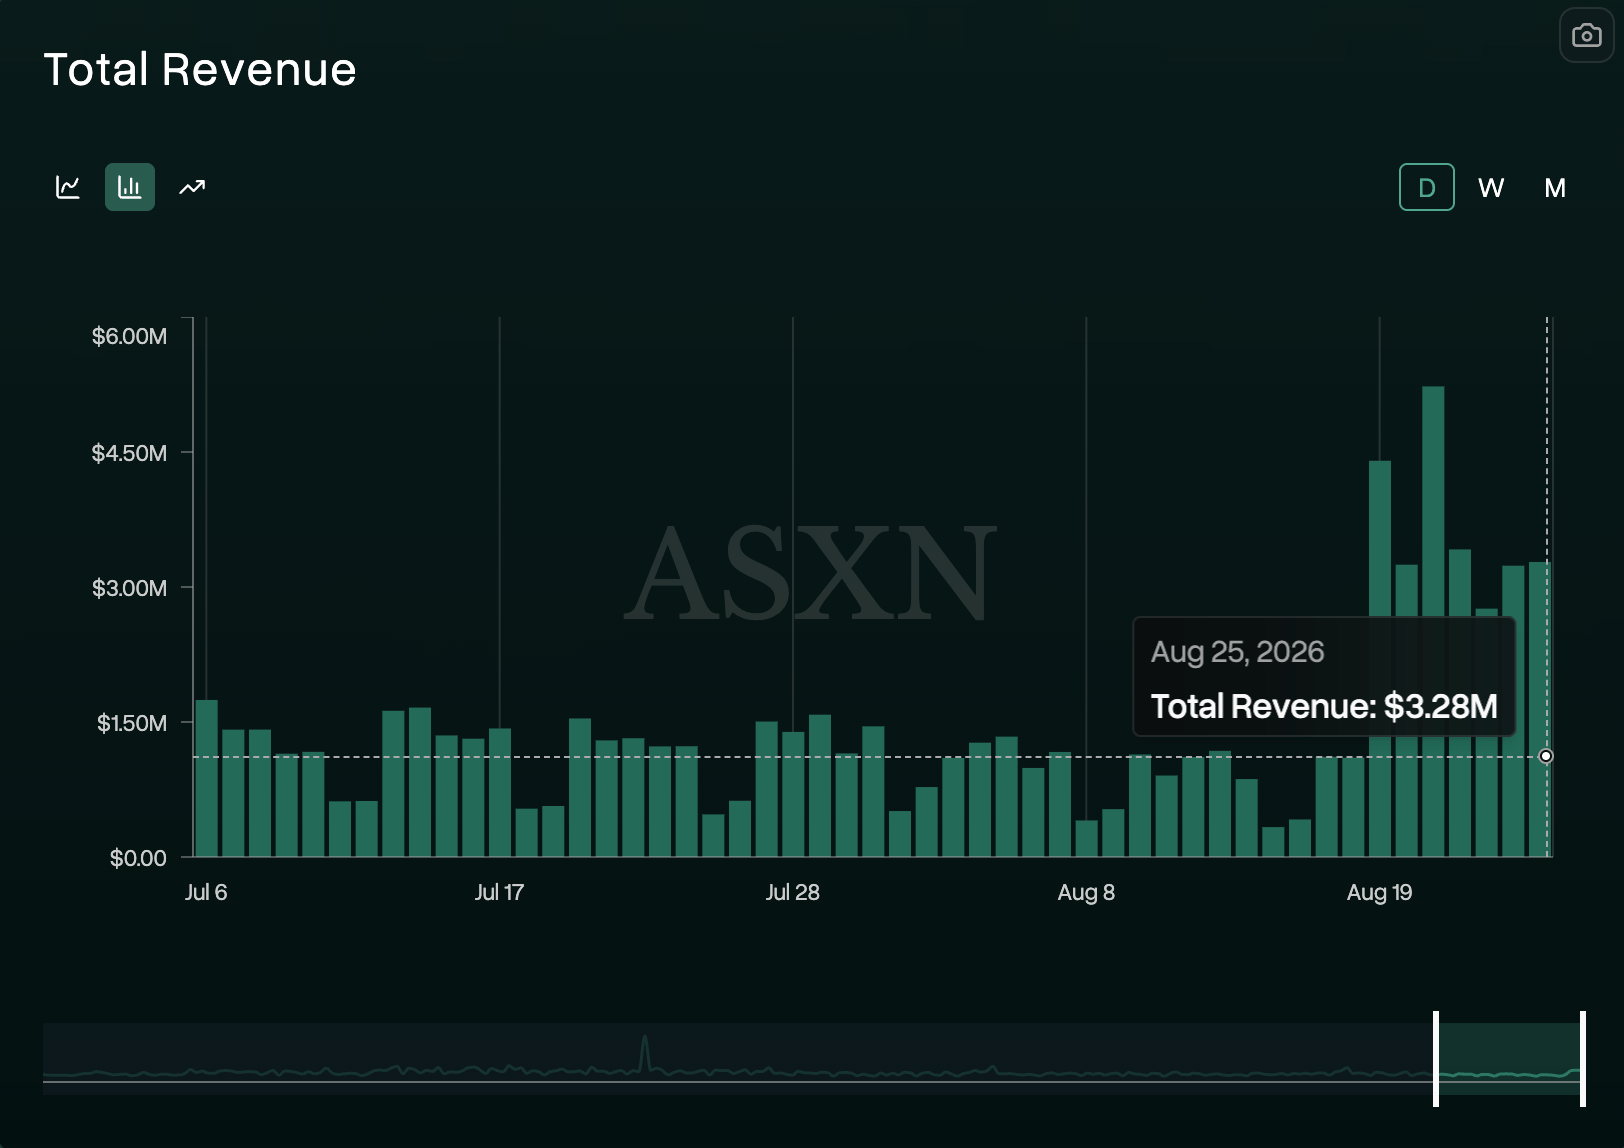
Hyperliquid is seeing increased user activity, resulting in higher revenue. The Decentralized Exchange recorded $5.23 million on Friday, marking its second-highest daily revenue so far in 2026. In addition, daily revenue collection has remained above $2.75 million over the last seven days, reaffirming elevated trading activity linked to renewed risk appetite among traders following the US Treasury’s decision to double the long-dated bond buyback operations to $4 billion.
Institutional demand for HYPE is rising
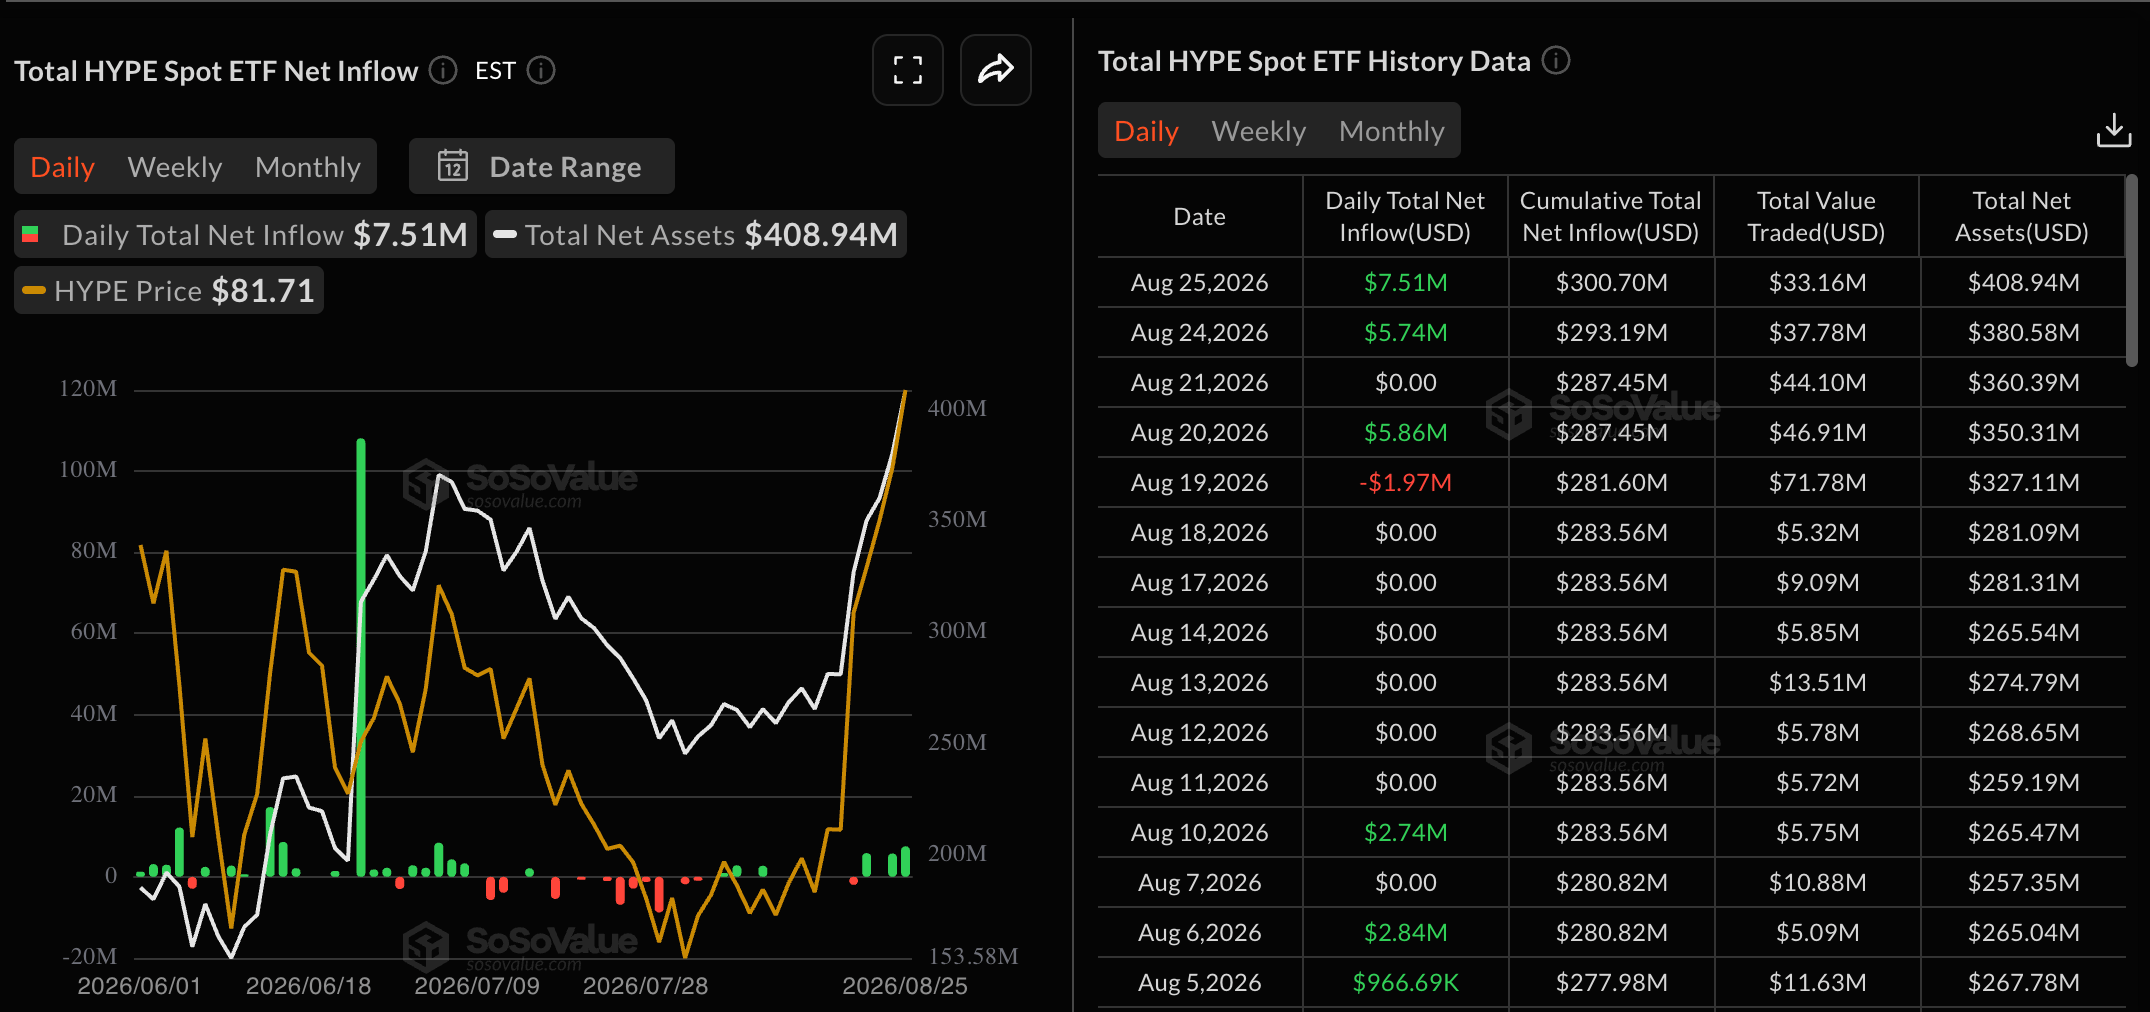
Institutional inflows in HYPE-focused funds indicate firm near-term demand. SoSoValue data shows HYPE ETFs recorded $7.51 million in inflows on Tuesday, up from $5.74 million the previous day, totaling the weekly inflow to $13.25 million so far this week, up from $3.89 million last week. This increase in institutional inflow improves the odds of a sustained uptrend in HYPE token by boosting retail sentiment.
Technical outlook: Could HYPE price hit $90?
Hyperliquid inches closer to $83.00 on Wednesday, up over 4% so far, extending its strong bullish phase toward a new record high. HYPE remains well above the 50-day Exponential Moving Average (EMA) near $63.70 and the 200-day EMA around $53.62, suggesting a firmly established uptrend.
From a technical perspective, HYPE tests the 127.2% Fibonacci extension level at $83.93, measured from the June 16 high at $76.93 to the August 2 low at $51.20. A confirmed breakout above this level could target the 161.8% Fibonacci extension at $92.83.
Momentum is stretched on the daily chart, with the Relative Strength Index (RSI) hovering near 77 in overbought territory, while the Moving Average Convergence Divergence (MACD) shows a steady rise with a wide spread of positive histogram, hinting that buyers still dominate.
On the downside, immediate support is seen at the previous swing high around $76.93, ahead of a broader cluster formed by the 78.6% and 50% Fibonacci retracements at $71.42 and $64.06, respectively.
(The technical analysis of this story was written with the help of an AI tool. Know more.)
Source link
Author

- Ytv Market News
- Share-market news writer and analyst with deep experience covering equities, commodities, forex, and cryptocurrencies for readers in the USA, UK, Canada, and Australia. Ytv Market News delivers timely market updates, practical trading insights, and clear explanations of macro and company-level catalysts that move prices. Combines on-the-ground financial reporting with technical analysis, using concise charts and actionable ideas to help investors and traders make smarter decisions.
Latest entries
 Crypto NewsAugust 26, 2026Will Pi Network sustain its mild recovery?
 CanadaAugust 26, 2026TARGA ANNOUNCES CLOSING OF FIRST TRANCHE OF NON-BROKERED PRIVATE PLACEMENT
 AustraliaAugust 26, 2026Estrella Resources Identifies Additional Copper Mineralisation at Laleno Dome
 Crypto NewsAugust 26, 2026Onchain Structured Products Infrastructure City Protocol Raises $11M Across Seed and Pre-A Rounds, Backed by Dragonfly, CMT Digital and Mirana


