


Bitcoin (BTC) and Ethereum (ETH) extend gains on Friday, trading above $80,000 and $2,500, respectively, having rallied over 3% and 1.5% so far this week. Meanwhile, Ripple (XRP) hovers around $1.44 on Friday, down more than 5% this week. The technical outlook for these top three cryptocurrencies remains constructive but is getting stretched, which could lead to a short-term correction.
Bitcoin upside momentum is still dominant but becoming stretched
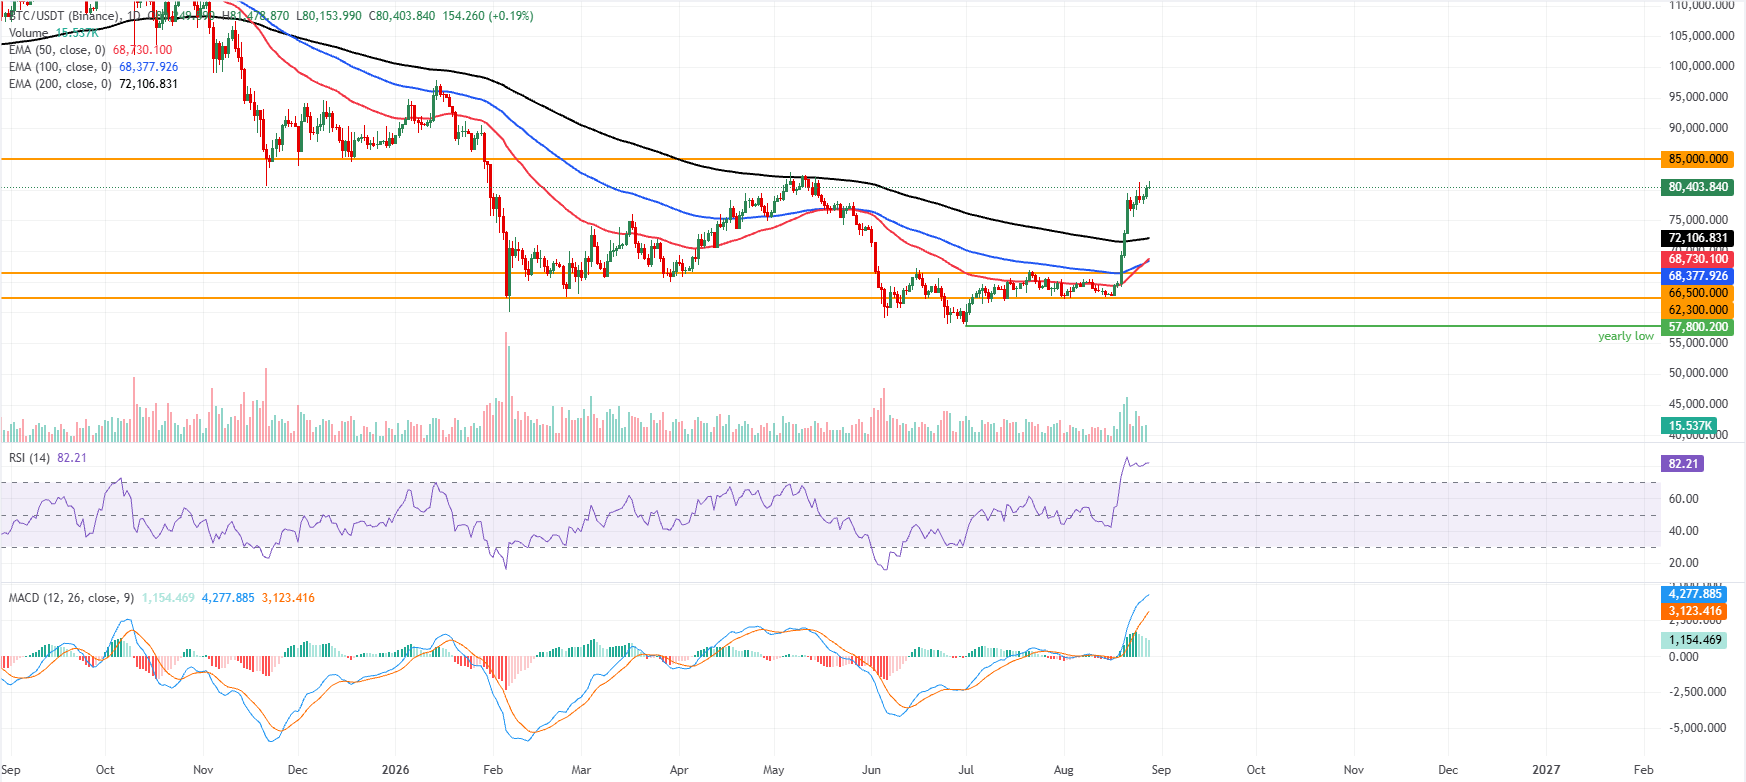
Bitcoin trades at $80,403 on Friday, keeping a clear bullish bias as price holds well above the 50-day, 100-day and 200-day Exponential Moving Averages (EMAs) clustered between roughly $68,400 and $72,100.
The strong advance has pushed the Relative Strength Index (RSI) into overbought territory near 82. At the same time, the Moving Average Convergence Divergence (MACD) indicator remains positive but is easing from recent extremes, suggesting upside momentum is still dominant but becoming stretched.
On the topside, the next notable resistance is the horizontal barrier at $85,000, where profit-taking could intensify if the rally extends.
On the downside, initial support is found at the rising 50-day EMA near $68,730, reinforced by the 100-day EMA at $68,377 and the 200-day EMA at $72,107, with additional structural floors at $66,500 and $62,300; a break back through this EMA cluster would be needed to suggest a more sustained corrective phase.
Ethereum could extend gains if $2,500 holds strong
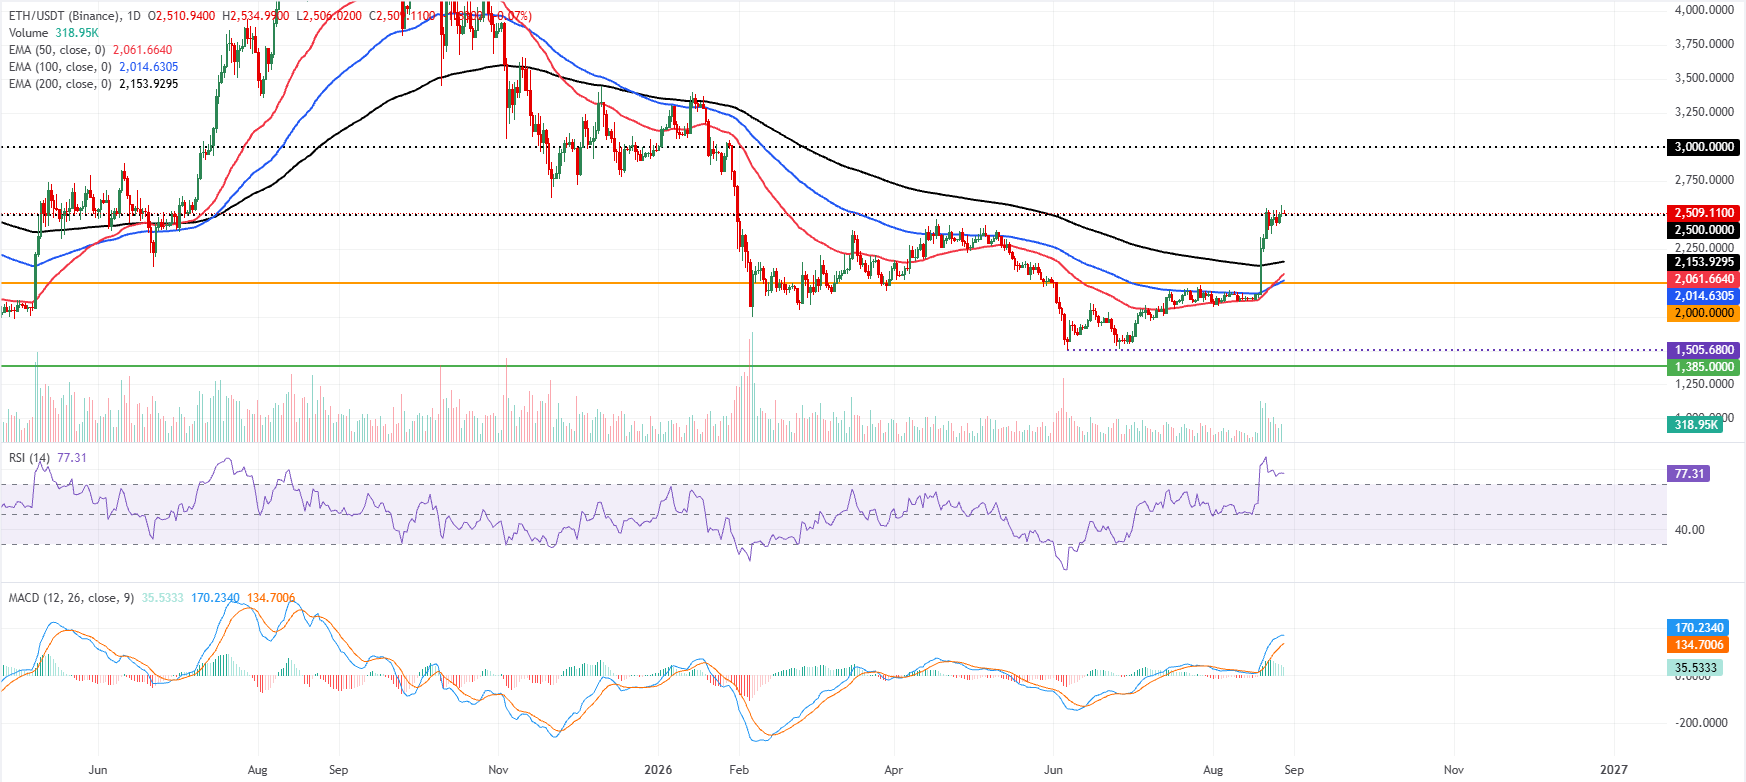
Ethereum price trades at $2,509 on Friday, extending a strong bullish phase above its main trend references. ETH price holds well above the 50-day, 100-day, and 200-day EMAs at $2,061, $2,014, and $2,153, respectively, reinforcing a constructive medium-term structure with layered dynamic support beneath spot.
The RSI at 77 sits in overbought territory and, at the same time, the MACD remains firmly positive, both of which suggest elevated bullish momentum but also increasing risk of a corrective pause after the recent vertical advance.
On the downside, immediate support is seen at the nearby horizontal level around $2,500, ahead of the 200-day EMA at $2,153 and the 50-day EMA at $2,061, with additional protection from the 100-day EMA at $2,014 and the prior horizontal floor at $2,000. A deeper pullback would expose more distant structural support near $1,385.
On the topside, the next notable resistance emerges at the psychological $3,000 hurdle, where buyers could begin to book profits if overbought signals persist.
XRP’s momentum remains stretched but constructive
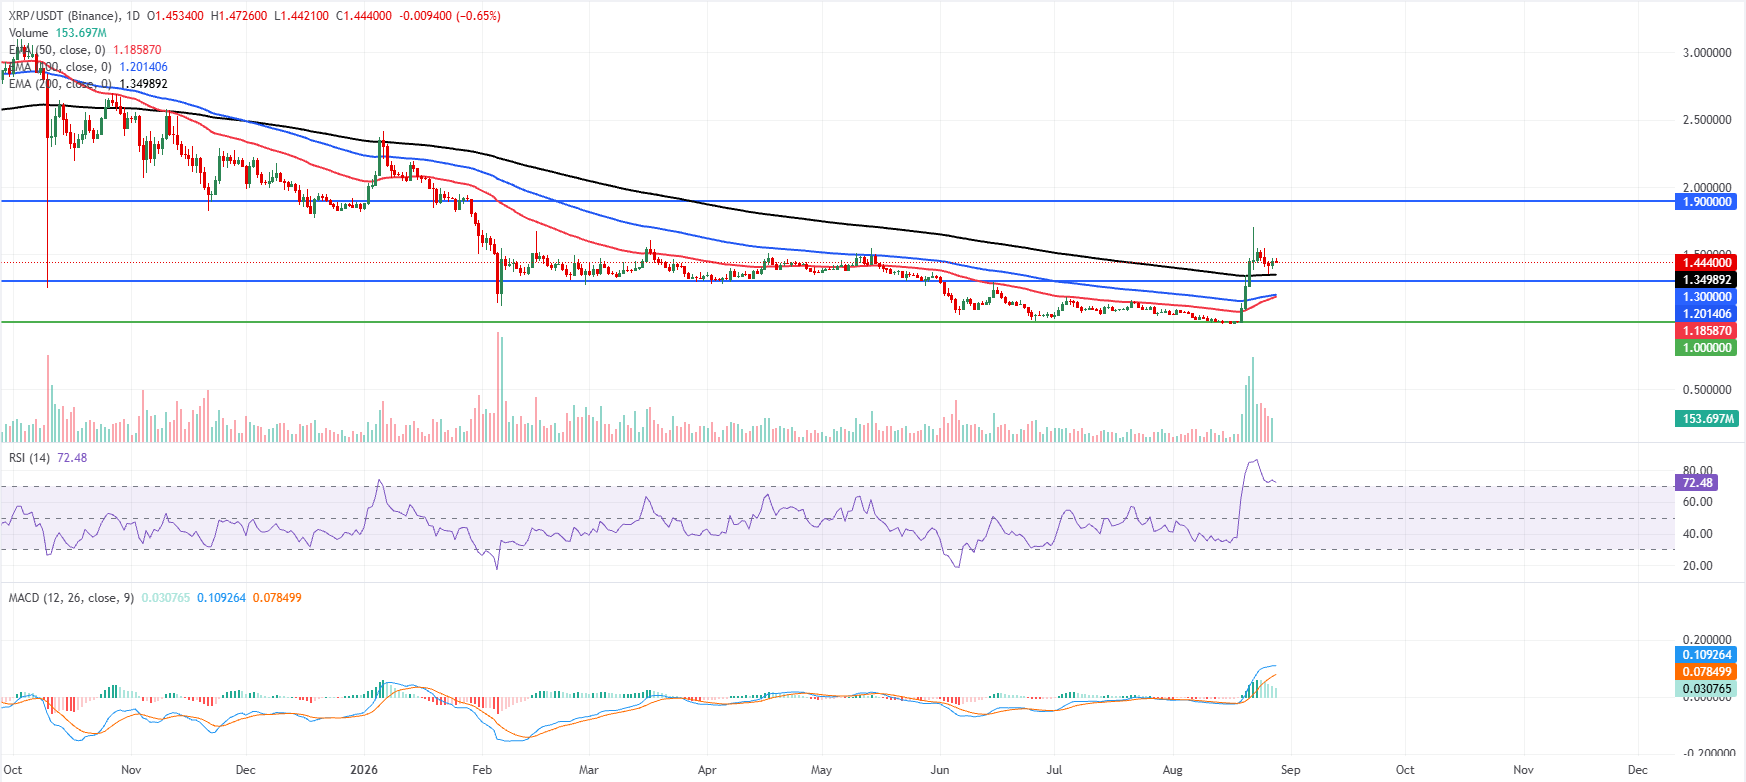
XRP price trades at $1.444 on Friday, extending a strong bullish phase after breaking decisively above its key EMAs. The 50-day, 100-day and 200-day EMAs at $1.185, $1.201 and $1.349 now sit well below spot, reinforcing an underlying uptrend while recent price action holds above the $1.300 horizontal floor.
Momentum remains stretched but constructive, with the RSI hovering in overbought territory near 73 and the MACD indicator above the signal line, suggesting buyers still retain control even as the rally looks increasingly extended.
On the downside, immediate support is near the recent breakout area around $1.349, where the 200-day EMA converges with prior supply, followed by the $1.300 horizontal level, which marks a stronger structural floor. Deeper pullbacks would expose the mid-bullish belt defined by the 100-day EMA at $1.201 and the 50-day EMA at $1.185 before the long-term base at $1.000.
On the topside, the next significant resistance does not emerge until the horizontal line around $1.900, leaving scope for further gains if dip-buying persists and overbought conditions unwind through consolidation rather than a sharp reversal.
(The technical analysis of this story was written with the help of an AI tool. Know more.)
Cryptocurrency prices FAQs
Source link
Author

- Ytv Market News
- Share-market news writer and analyst with deep experience covering equities, commodities, forex, and cryptocurrencies for readers in the USA, UK, Canada, and Australia. Ytv Market News delivers timely market updates, practical trading insights, and clear explanations of macro and company-level catalysts that move prices. Combines on-the-ground financial reporting with technical analysis, using concise charts and actionable ideas to help investors and traders make smarter decisions.
Latest entries
 Stock Market VideosAugust 28, 2026US Primaries Set Stage For Midterm Elections
 UkAugust 28, 2026TRADING UPDATES: JPM Global Core liquidation; IGC shareholder’s rebuke
 UsaAugust 28, 2026Press Release: Subramanyam and Nunn Introduce Bill to Update Reserve Organization Charter
 Crypto NewsAugust 28, 2026HYPE Price Jumps 5% as Hyperliquid Strategies Grows Treasury to 29.3M Tokens


