


Bitcoin (BTC) extends gains, trading above $80,000 at the time of writing on Tuesday following its strongest weekly rise in more than three years. Institutional demand continues to support this rally, with spot Exchange Traded Funds (ETFs) recording positive inflows on Monday. Despite this growing demand, traders should remain cautious as profit-taking, falling open interest despite rising prices, and overstretched momentum indicators increase the chances of a pullback toward the Crypto King.
Institutional demand strengthens
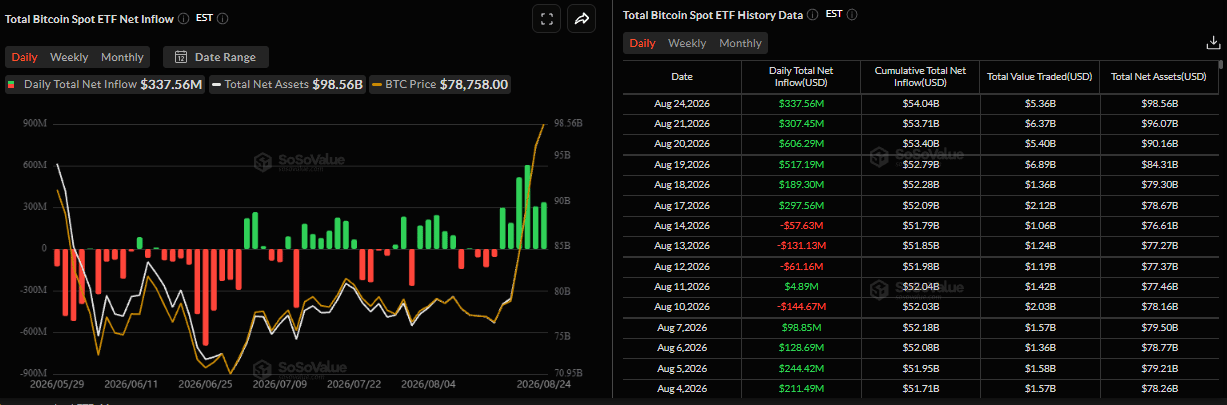
Institutional demand for Bitcoin continues to strengthen as the week begins. SoSoValue data showed spot ETFs recorded $337.56 million on Monday, marking the sixth consecutive day of positive flows since August 17. If this trend continues through this week, BTC could rally further.
Profit-taking activity and falling open interest could trigger a pullback
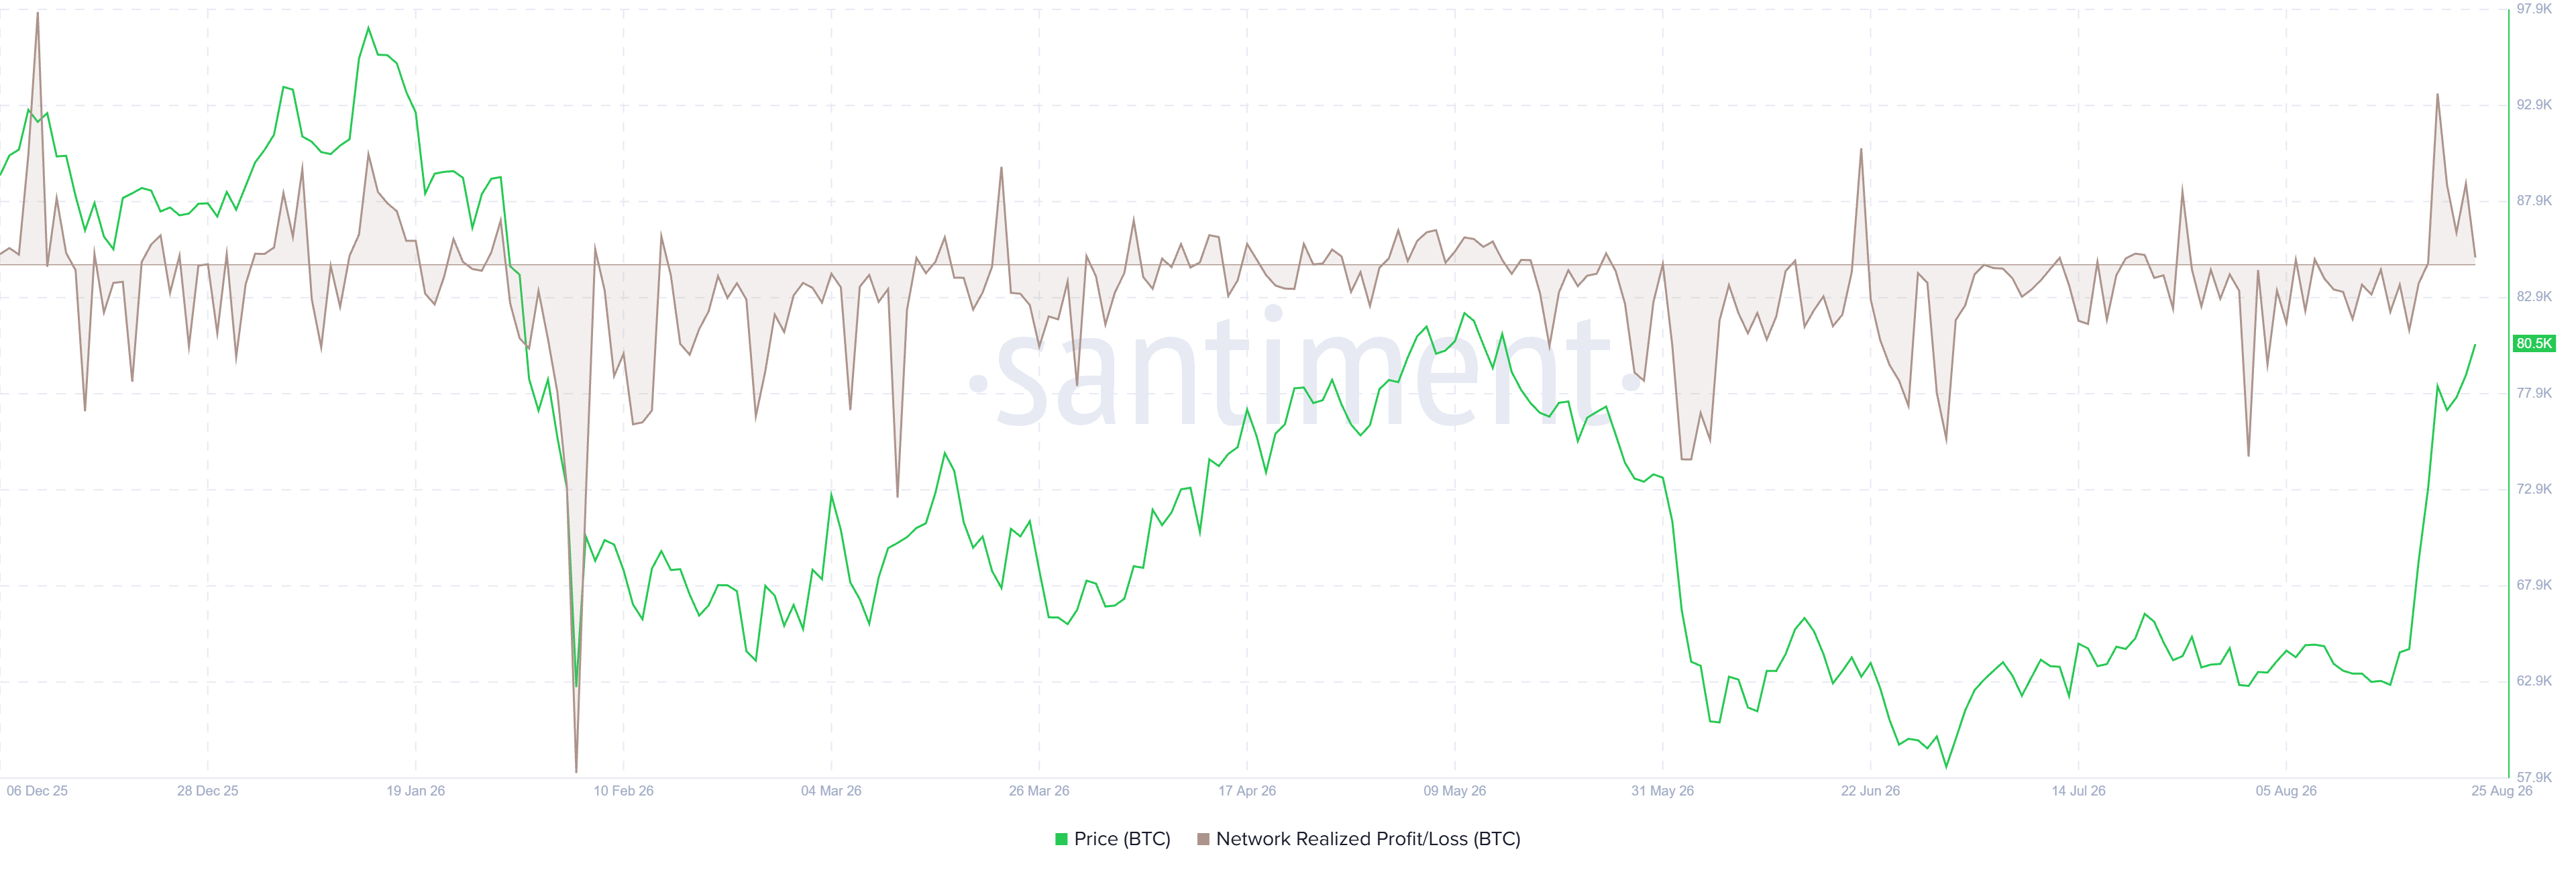
Santiment’s Network Realized Profit/Loss (NPL) metric indicates that Bitcoin holders are booking some profits as the Crypto King continues to rally.
As shown in the chart below, the metric spiked sharply on Friday and Monday, reaching its highest level since December 10, 2025. This spike indicates that holders are, on average, selling their bags at a significant profit, thereby increasing the selling pressure.
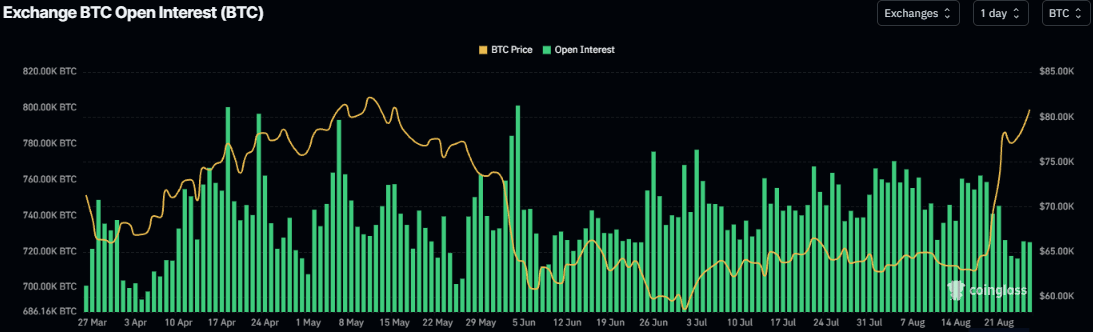
The derivatives metrics also show cautious signs. BTC’s futures Open Interest (OI) has been falling steadily, reaching 725.10K BTC on Tuesday from 762.24K BTC on August 18. The decline in OI, despite rising BTC prices and falling trading volume, suggests weakening participation behind the rally and raises the risk of a near-term correction.
Bitcoin technical outlook: Overstretched momentum
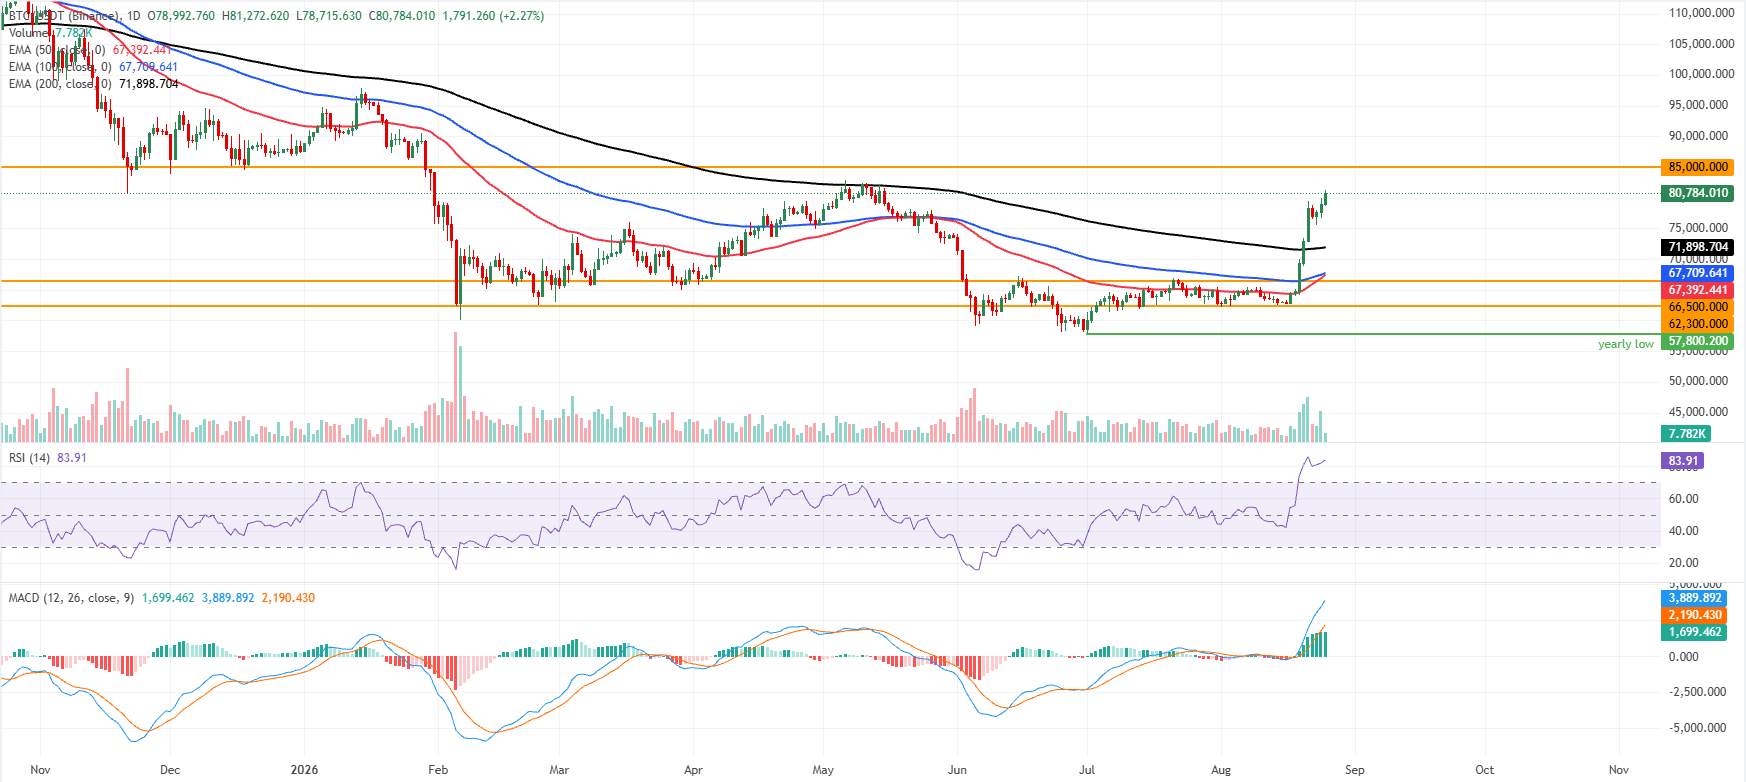
Bitcoin price trades around $80,700 on Tuesday, maintaining a firm bullish bias as it holds well above the 50-day, 100-day, and 200-day Exponential Moving Averages (EMAs) clustered between roughly $67,400 and $71,900.
The Relative Strength Index (RSI) extends deep into overbought territory near 84 on the daily chart. At the same time, the Moving Average Convergence Divergence (MACD) line remains well above zero and prior highs, suggesting strong but potentially overextended upside momentum.
On the topside, the next key hurdle is horizontal resistance around $85,000, where profit-taking could slow the advance.
On the downside, initial support is seen at the 200-day EMA near $71,898, with additional demand expected around the 100-day EMA at $67,709 and the 50-day EMA at $67,392; a deeper pullback would expose horizontal supports at $66,500 and then $62,300.
(The technical analysis of this story was written with the help of an AI tool. Know more.)
Bitcoin, altcoins, stablecoins FAQs
Bitcoin is the largest cryptocurrency by market capitalization, a virtual currency designed to serve as money. This form of payment cannot be controlled by any one person, group, or entity, which eliminates the need for third-party participation during financial transactions.
Altcoins are any cryptocurrency apart from Bitcoin, but some also regard Ethereum as a non-altcoin because it is from these two cryptocurrencies that forking happens. If this is true, then Litecoin is the first altcoin, forked from the Bitcoin protocol and, therefore, an “improved” version of it.
Stablecoins are cryptocurrencies designed to have a stable price, with their value backed by a reserve of the asset it represents. To achieve this, the value of any one stablecoin is pegged to a commodity or financial instrument, such as the US Dollar (USD), with its supply regulated by an algorithm or demand. The main goal of stablecoins is to provide an on/off-ramp for investors willing to trade and invest in cryptocurrencies. Stablecoins also allow investors to store value since cryptocurrencies, in general, are subject to volatility.
Bitcoin dominance is the ratio of Bitcoin’s market capitalization to the total market capitalization of all cryptocurrencies combined. It provides a clear picture of Bitcoin’s interest among investors. A high BTC dominance typically happens before and during a bull run, in which investors resort to investing in relatively stable and high market capitalization cryptocurrency like Bitcoin. A drop in BTC dominance usually means that investors are moving their capital and/or profits to altcoins in a quest for higher returns, which usually triggers an explosion of altcoin rallies.
Source link
Author

- Ytv Market News
- Share-market news writer and analyst with deep experience covering equities, commodities, forex, and cryptocurrencies for readers in the USA, UK, Canada, and Australia. Ytv Market News delivers timely market updates, practical trading insights, and clear explanations of macro and company-level catalysts that move prices. Combines on-the-ground financial reporting with technical analysis, using concise charts and actionable ideas to help investors and traders make smarter decisions.
Latest entries
![This was the most obviously buy signal of the year [Video]](https://ytvmarketnews.com/wp-content/uploads/2026/08/1787650519_cryptos-coins_Medium.png) Crypto NewsAugust 25, 2026This was the most obviously buy signal of the year [Video]
Crypto NewsAugust 25, 2026This was the most obviously buy signal of the year [Video] CanadaAugust 25, 2026Scotiabank Launches New No Fee Visa Credit Card for Canadian Business Owners with 1% Cash Back on Every Purchase
 UkAugust 25, 2026Wall Street Futures Rise as Iran Sanctions, Nvidia Earnings and Bitcoin Rally Take Focus: Dow Jones, S&P, Nasdaq
 AustraliaAugust 25, 2026White Cliff Minerals Confirms 480% Expansion to Danvers 1 Copper System at Rae Project


