

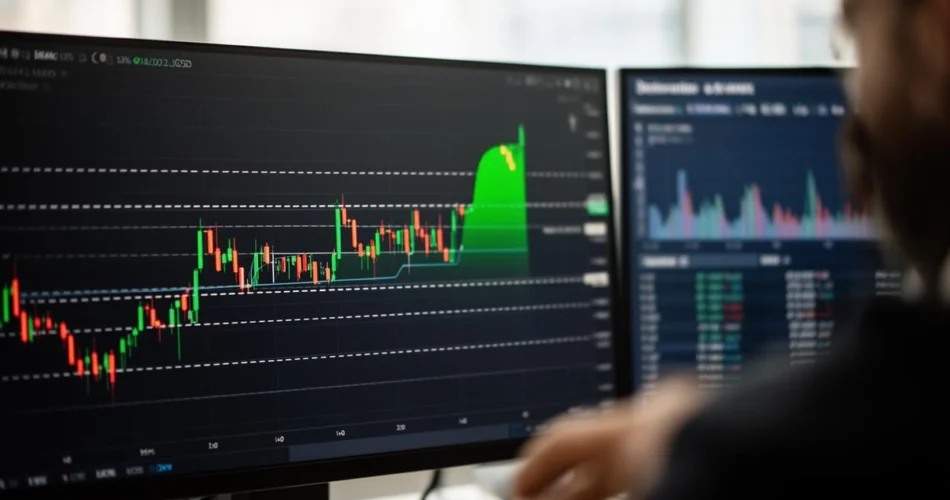
Solana is holding above $95 after staging a sharp recovery from the $60 range, with technical analysts mapping a path toward $114 in the near term and a broader zone between $160 and $180 if the current bullish structure remains intact.
The token traded near $95.92 on August 23, sitting just above the 23.6% Fibonacci retracement at $95.13, a level that has emerged as the first line of defense for the developing rally. Additional support sits at $90.69, the 38.2% retracement, and $87.26, the 50% level.
Wave 4 Correction Shapes Short-Term Outlook
Following a third-wave surge that carried SOL from the upper $70s to around $100, analysts interpreting the price action through an Elliott Wave framework see the current consolidation as a wave 4 correction. The pullback is mapped as an A-B-C pattern, suggesting further downside toward the lower Fibonacci levels remains possible before the correction completes.
Immediate resistance sits in the $99 to $100 range. A decisive move above this area would signal that buyers have absorbed selling pressure and are ready to refocus on higher targets. Should support hold, projections point toward a fifth-wave advance targeting $114 to $116.
The stakes around the $100 mark are considerable. Solana tested the 96-100 resistance zone multiple times earlier in 2026 but failed to convert it into support. Analyst woods.ai described the area as the main level Solana must flip before attempting a return toward $200. A brief move above $100 would not provide sufficient confirmation; buyers would need to hold the breakout during a retest and continue building momentum above the former resistance zone.
A successful breakout would initially bring the $120 and $140 regions back into focus. Solana would then need to clear remaining weekly supply zones before a $200 target became technically credible.
The downside risk remains a rejection near $100. Failure to close above the resistance area could send SOL back toward $80, with the mid-$70s providing the next important support zone. A deeper decline could expose the previous base near $60-$65 and weaken the developing recovery structure.
Weekly Momentum Turns Green
Solana produced its first green weekly momentum dot after months of bearish signals, suggesting the market may be entering an early expansion phase. However, SOL must close above the 96.60-97.49 resistance area to confirm a stronger trend reversal.
The move marks the strongest weekly advance since the token established a base around $66 in June. The green dot represents an initial momentum shift following a long sequence of red signals, supporting a “Stage 2” expansion outlook, though the signal remains preliminary because the weekly candle has not closed.
A confirmed breakout above $97 could expose $116, followed by larger resistance zones at $137 and $164. Solana would also need to move above its declining trend indicator before establishing a sustained bullish structure.
Futures Activity Far Ahead of Spot Demand
Derivatives data from CoinGlass shows a notable imbalance between futures and spot trading. Futures volume reached roughly $19.33 billion, while spot turnover was only $1.88 billion — slightly more than $10 in futures trading for every dollar traded on the spot market.
Key market metrics as of August 22:
| Metric | Value |
|---|---|
| Futures volume | $19.33B |
| Spot volume | $1.88B |
| Open interest | $5.81B |
| 24-hour liquidations | $108.35M |
| Weekly gain | 25.3% |
Note: Data from CoinGlass SOL overview, reviewed August 22, 2026. Figures change continuously.
The liquidation data confirms the rally has not been orderly. Short covering helped accelerate the move higher, while the remaining open interest leaves SOL exposed if late longs begin exiting at the same time.
Funding rates are the next important signal. In perpetual futures, positive funding means longs pay shorts. Modestly positive funding is common during a rally, but rapidly rising funding alongside expanding open interest would point to a crowded long trade and raise the chance of a sharp flush.
Long-Term Recovery Eyes $160-$180 Targets
On the weekly chart, Solana recently posted a 26% gain, rebounding from the $60s to near $94. Analyst Rod interprets this as the completion of a major A-B-C correction, with the final low labeled as wave 5 of wave C.
If this Elliott Wave count holds true, the lengthy correction from Solana’s 2025 peaks could be complete, setting up a shift from downward pressure to a phase of accumulation and potential price recovery.
The next major upside target spans $160 to $180, where significant historical resistance remains from earlier trading ranges. Before tackling this zone, Solana must first reclaim resistance near $100 and generate upward momentum through the $120-$140 corridor.
The path to higher levels is not expected to be linear. Analysts anticipate intermittent pullbacks and consolidations as SOL works to establish a higher-low structure. The failure to hold recent correction lows would undermine this bullish scenario and make another move lower possible.
On the daily chart, Solana has already cleared several major technical levels. The reversal from the $74 area, which coincides with the 0.382 Fibonacci retracement, allowed the token to reclaim its 50-day ($77), 100-day ($76), and 200-day ($81) moving averages. SOL then broke above the $90 resistance and reached $102 before pulling back to around $94.
The daily RSI reached 83, placing SOL firmly in overbought territory. Strong trends can keep the indicator elevated, but the higher it climbs, the greater the risk of abrupt intraday pullbacks.
For now, Solana sits at the boundary between another failed rally and a larger weekly breakout. The reaction around $100 — particularly the weekly close and any subsequent retest — should determine whether buyers can extend the recovery toward higher targets. A modest pullback with flat or declining open interest would suggest profit-taking rather than a broader leverage unwind, while stronger spot participation would give the breakout a more durable base than futures-led buying alone.
Source link
Author

- Ytv Market News
- Share-market news writer and analyst with deep experience covering equities, commodities, forex, and cryptocurrencies for readers in the USA, UK, Canada, and Australia. Ytv Market News delivers timely market updates, practical trading insights, and clear explanations of macro and company-level catalysts that move prices. Combines on-the-ground financial reporting with technical analysis, using concise charts and actionable ideas to help investors and traders make smarter decisions.
Latest entries
 Forex NewsAugust 24, 2026Euro holds near three-month highs as investors await US sanctions to Iran
 IndiaAugust 24, 2026Iran discovers 7,500-bcf gas field in Fars Province
 Company Press ReleasesAugust 24, 2026NKT qualifies 525 kV HVDC subsea power cable system for operation at 90 °C
 Company NewsAugust 24, 2026Die PENN-Entertainment-Aktie bleibt nach schwächerem Quartal unter Druck


