


Sixt earnings and guidance set the tone for 2026
Sixt (XTRA:SIX2) has drawn fresh attention after reporting second quarter and first half 2026 results, alongside confirming full year guidance, giving investors updated figures on revenue, profitability and expected earnings margins.
See our latest analysis for Sixt.
Despite confirming 2026 guidance and reporting higher sales and net income for the first half of the year, Sixt’s recent share price performance has been mixed. The company recorded a 1.99% 1 month share price return, but its 1 year total shareholder return declined 13.7% and its 5 year total shareholder return declined 22.76%, suggesting sentiment has yet to fully align with the latest results.
If you want to see how other companies are being priced as growth stories evolve, broaden your search with the 112 top founder-led companies
Sixt shares have edged higher in the short term, while longer term returns remain weak and the stock trades below both analyst targets and intrinsic estimates. So where does a reasonable fair value range really sit now?
Price-to-earnings of 11.1x for Sixt: Is it justified?
On the numbers, Sixt looks priced below what many peers command. The stock closed at €71.90, trades at a P/E of 11.1x, and screens as good value relative to both its own fair ratio estimate of 16.1x and the broader European transportation group.
The P/E multiple compares the current share price to earnings per share. For a business like Sixt with established profitability and a sizeable rental and mobility network across Europe and North America, this ratio is a simple way to see how much investors are currently paying for each euro of earnings.
Here the gap is clear. Sixt trades at a P/E of 11.1x, while the peer average sits at 17.4x and the estimated fair P/E for the company is 16.1x. That is a sizeable discount to where similar companies change hands and also below the level that regression analysis suggests the multiple could move toward if the market repriced the stock closer to its earnings profile.
Explore the SWS fair ratio for Sixt
Result: Price-to-earnings of 11.1x (UNDERVALUED)
However, Sixt still faces risks related to weaker long term shareholder returns, and any slowdown in revenue or net income growth could limit a valuation rerating.
Find out about the key risks to this Sixt narrative.
Another view on Sixt using our DCF model
The earlier P/E work suggests Sixt trades at a discount, and the SWS DCF model offers a second lens. At €71.90, the stock sits about 12.4% below an estimated future cash flow value of €82.11. That still points to undervaluation. Which signal should you prioritise when both point in the same direction?
Look into how the SWS DCF model arrives at its fair value.
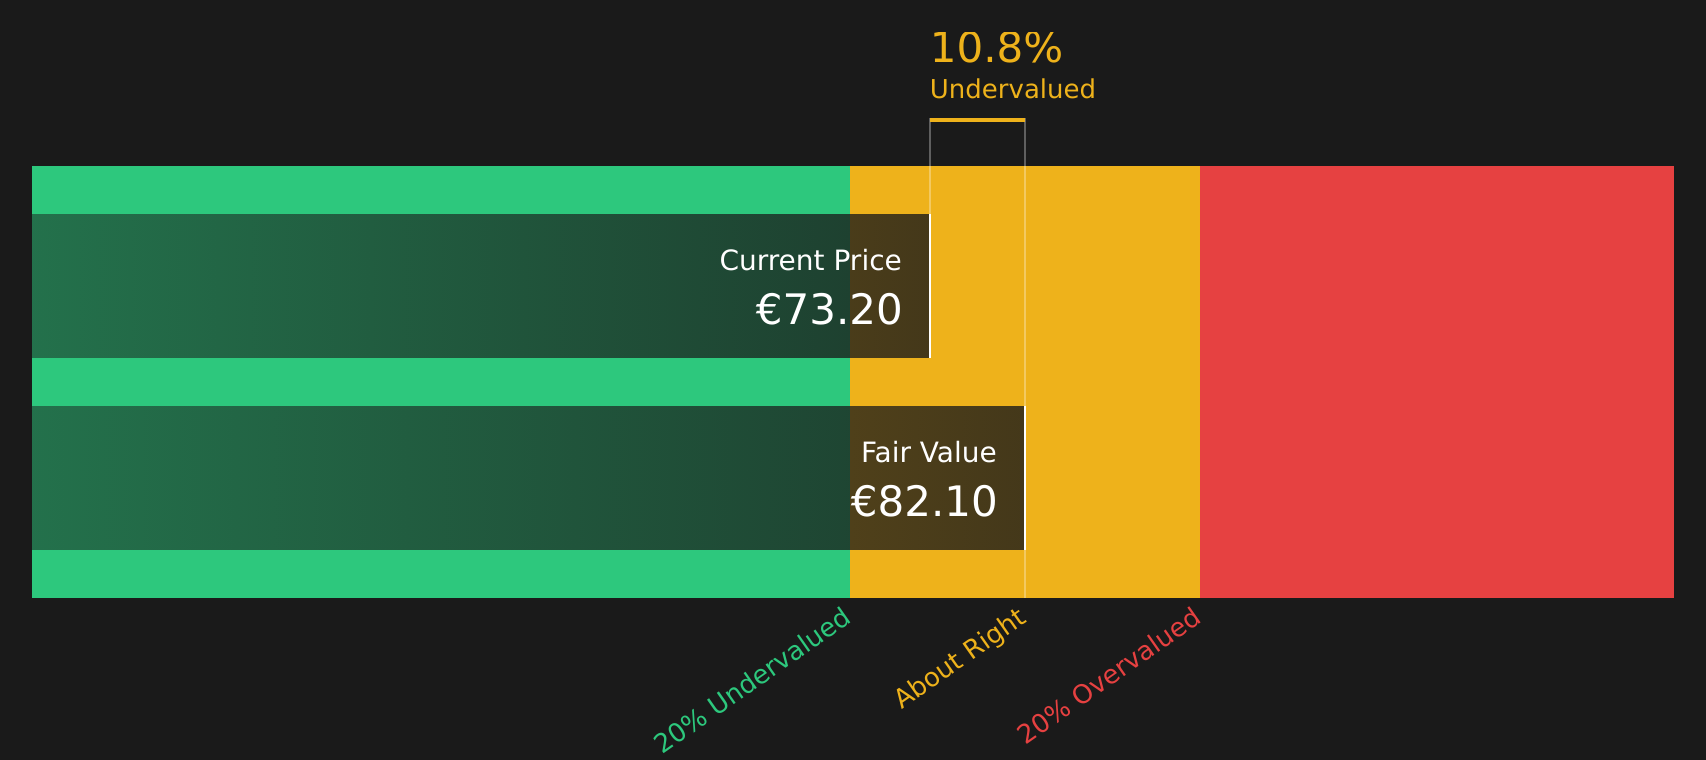
Simply Wall St performs a discounted cash flow (DCF) on every stock in the world every day (check out Sixt for example). We show the entire calculation in full. You can track the result in your watchlist or portfolio and be alerted when this changes, or use our stock screener to discover 270 high quality undervalued stocks. If you save a screener we even alert you when new companies match – so you never miss a potential opportunity.
Next Steps
The mixed signals on Sixt might feel unclear, so this is a good moment to review the numbers and form your own judgement. To see both sides of the current debate in one place, take a closer look at the 4 key rewards and 2 important warning signs
Looking for more investment ideas beyond Sixt?
If Sixt has your attention, do not stop there. Use this momentum to review other opportunities so you are not relying on a single stock story.
This article by Simply Wall St is general in nature. We provide commentary based on historical data
and analyst forecasts only using an unbiased methodology and our articles are not intended to be financial advice. It does not constitute a recommendation to buy or sell any stock, and does not take account of your objectives, or your
financial situation. We aim to bring you long-term focused analysis driven by fundamental data.
Note that our analysis may not factor in the latest price-sensitive company announcements or qualitative material.
Simply Wall St has no position in any stocks mentioned.
New: Manage All Your Stock Portfolios in One Place
We’ve created the ultimate portfolio companion for stock investors, and it’s free.
• Connect an unlimited number of Portfolios and see your total in one currency
• Be alerted to new Warning Signs or Risks via email or mobile
• Track the Fair Value of your stocks
Have feedback on this article? Concerned about the content? Get in touch with us directly. Alternatively, email editorial-team@simplywallst.com
Source link


