

The Shiba Inu (SHIB) meme token is ending the month with an all-time record August return, confirming a break in its long-term downtrend. However, the asset’s historical vulnerability to September seasonality, combined with technical signals, indicates that a serious correction threat is looming over the market.
August “Big Win”
As of Thursday, SHIB is trading at $0.00000535, retaining a 14.8% gain for the month, according to TradingView price data. The current momentum allowed the token to break an 11-month bearish trend and post the best August performance in its history, surpassing the previous record of +10.1% set in 2021.
Against this backdrop, its third-quarter (Q3) return has soared to +28.1%, compared with a historical median of just +2.56%.
You Might Also Like

The main driver behind this big win was a significant breakthrough in Japan. On Aug. 21, Japan’s Financial Services Agency (FSA) approved SHIB for listing on the licensed Laser Digital Japan platform, part of the Nomura Group.
The token’s inclusion in an exclusive list of six assets available to Japanese institutional investors brought in regulated capital and lifted its market capitalization to $3.2 billion.
September “curse” and technical dead end
Because the August rally was driven entirely by news, holding the current levels carries substantial risks. According to CryptoRank statistics, the upcoming month of September poses a traditional threat. Throughout its entire trading history, the asset has never closed September with a convincing gain, while the median return for the month stands at -2.99%.
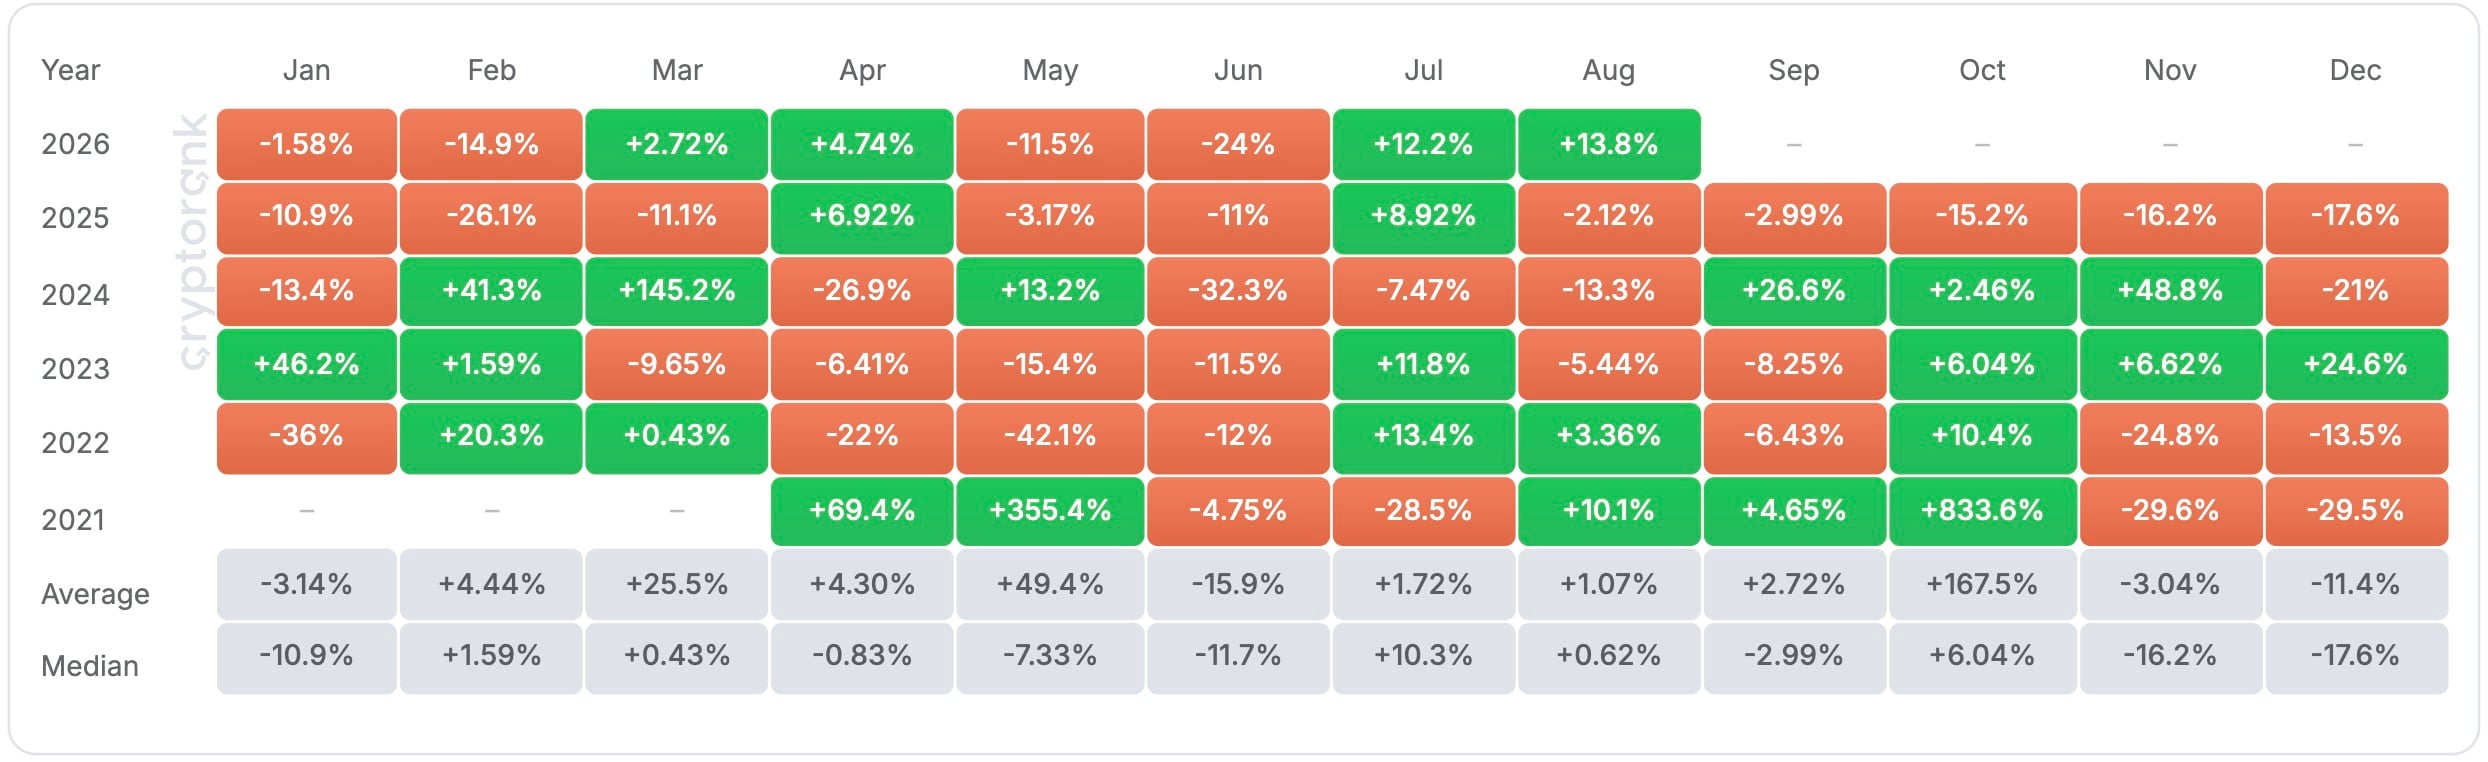
If this seasonal pressure materializes, the overheated quarterly return risks quickly evaporating, with the price’s next move depending on whether key levels hold under the following scenarios:
- Bearish scenario (holder panic): If the bulls lose local support at $0.00000525, a cascade of stop-loss orders from retail investors will be triggered. In this case, the main downside target will be the complete erasure of the August momentum and a return to the summer lows around $0.00000430.
- Bullish scenario (controlled cooldown): The market enters a sideways correction while remaining above $0.00000525. The September pullback is used by market makers solely to cool down the indicators ahead of the traditionally strong fourth quarter (Q4), for which SHIB has a solid historical median return of +20.3%.
You Might Also Like

The technical picture on TradingView’s weekly time frame already confirms the gradual exhaustion of buying strength. An attempt to break through the key resistance level — the blue exponential moving average (EMA) at $0.00000693 — resulted in a false breakout.
The current candle is down 3.41% for the week and is forming a long upper wick, signaling that major players have begun taking profits. Meanwhile, the RSI (47.62) has also started turning downward, confirming a lack of bullish momentum.
Source link
Author

- Ytv Market News
- Share-market news writer and analyst with deep experience covering equities, commodities, forex, and cryptocurrencies for readers in the USA, UK, Canada, and Australia. Ytv Market News delivers timely market updates, practical trading insights, and clear explanations of macro and company-level catalysts that move prices. Combines on-the-ground financial reporting with technical analysis, using concise charts and actionable ideas to help investors and traders make smarter decisions.
Latest entries
 Crypto NewsAugust 29, 2026Bitcoin Mining Uses 30% of Paraguay’s Electric Energy: Crisis Warned for 2029
 Investing InsightsAugust 29, 2026Fastly (FSLY) Tweaks Credit Lines: Subtle Shift In Risk Profile Or Liquidity Confidence Signal?
 Investing InsightsAugust 29, 2026Morning Wrap: Markets freeze before Jackson Hole. Bitcoin back below 80K USD (28.08.2026)
 UsaAugust 29, 2026Affirm Stock: Follow Now and Buy Later or Buy Right Now?


