


When it comes to the stock market, history may not repeat itself to a “T,” but it often rhymes in ways that unsettle even the most confident investors. Markets tend to climb higher on waves of optimism, only for familiar pressures to reappear in new forms.
At recent prices, the S&P 500 (^GSPC -0.02%) sits around 7,670, a level that towers over the records of prior decades. After years of outsize advances, the index has delivered a roughly 12% gain this year. Yet the backdrop of this ascent includes lingering uncertainties about inflation, the Federal Reserve’s next move on interest rates, and the ongoing Iran conflict.
Against this multi-year rally, the possibility of a correction is beginning to feel less like distant theory and more like a reality waiting to play out.

Image source: Getty Images.
How do we know the stock market is overvalued?
When it comes to valuation, investors can rely on two time-tested tools. The cyclically adjusted price-to-earnings (CAPE) ratio is a metric that was popularized by economist Robert Shiller. The CAPE ratio divides the current market price by the average of 10 years of inflation-adjusted earnings. By smoothing out isolated booms and recessions, CAPE readings more accurately determine whether investors are paying a premium for corporate profits.
The CAPE’s long-run average hovers around 18, and readings above 30 have often preceded extended periods of single-digit or even negative returns. Currently, the CAPE ratio hovers around 41 — among its highest levels ever recorded and within shouting distance of the all-time extremes seen during dot-com euphoria in the late 1990s.
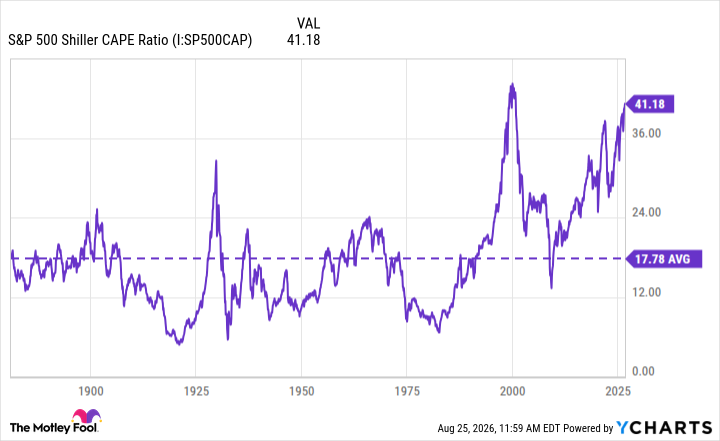
S&P 500 Shiller CAPE Ratio data by YCharts.
Complementing the CAPE ratio is the Buffett indicator, which measures the total market capitalization of U.S. stocks relative to gross domestic product (GDP). As a rule of thumb, when the indicator climbs above 100%, stocks have historically been priced for perfection. Today, the Buffett indicator stands near 236%.
Both of these metrics are important because they drain out short-term noise and focus on the premium investors are currently assigning to future growth. While elevated readings in both ratios do not dictate any precise timing of a stock market correction, they reliably flag that the margin of safety is narrowing.
Will the stock market crash in 2026?
Elevated CAPE and Buffett readings have historically been followed by periods of digestion in which stock prices consolidate. With that said, there is no guarantee that a sharp correction must arrive within a specific time frame. Rather, these tools simply raise the probability that a meaningful pullback will occur at some point.
What makes the current environment unique is the unusual concentration of the market’s gains in a handful of mega-cap tech companies: not just the “Magnificent Seven” — Nvidia, Apple, Alphabet, Microsoft, Amazon, Tesla, and Meta Platforms — but also Taiwan Semiconductor Manufacturing and Broadcom, which have also led the long-term rally and each sport valuations well over $1 trillion, like the others. These companies generate substantial free cash flow, dominate their respective industries, and continue to reinvest in transformative technologies — namely, artificial intelligence (AI).
Unlike the speculative excess of the dot-com era, during which many unprofitable start-ups traded at fantasy valuations, today’s market leaders are generally delivering tangible earnings and maintaining fortress balance sheets. This means the AI infrastructure wave rests on real productivity gains rather than pure narrative, for now.
While concentration risk is real, the underlying profitability of big tech provides a sturdier foundation than the froth between 1999 and 2000. A correction could — and likely will — still materialize, but the character of the current advances in the market differs enough that any eventual pullback won’t resemble the exact cascading collapse of prior bubbles.
This investing strategy has never failed
Over every market cycle, the S&P 500 has always advanced — recovering from recessions, wars, and valuation extremes. This long-run upward drift is perhaps the most reliable pattern in the stock market.
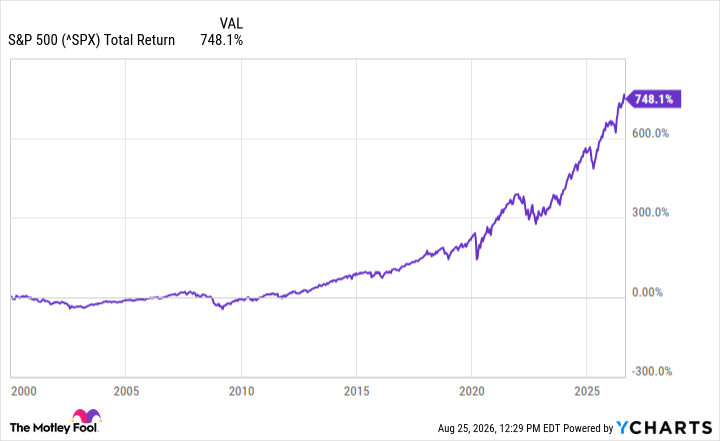
With this in mind, a practical response is pretty straightforward: Investors can buy a low-cost S&P 500 exchange-traded fund such as the Vanguard S&P 500 ETF. By committing to dollar-cost averaging — investing a fixed sum at regular intervals — regardless of the day’s price, investors automatically buy exposure to the most resilient market vehicle of all time.
Over the course of a few decades, the compounding effect of reinvested dividends and gradual capital appreciation will turn modest contributions into substantial wealth. In time, investors will come to realize that drawdowns become opportunities to buy the dip. By remaining fully invested through the inevitable volatility, disciplined capital will capture the durability of the market’s growth without the impossible task of timing every peak and valley.
Source link
Author

- Ytv Market News
- Share-market news writer and analyst with deep experience covering equities, commodities, forex, and cryptocurrencies for readers in the USA, UK, Canada, and Australia. Ytv Market News delivers timely market updates, practical trading insights, and clear explanations of macro and company-level catalysts that move prices. Combines on-the-ground financial reporting with technical analysis, using concise charts and actionable ideas to help investors and traders make smarter decisions.
Latest entries
 AustraliaAugust 27, 2026Infragreen Group Posts Record FY26 Earnings as Energybuild Leads Growth
 Crypto NewsAugust 27, 2026Ripple (XRP) Whales Are Pulling Millions Off Binance: The $2 Level Is Back in Focus
 Crypto NewsAugust 27, 2026While Others Invest in AI, RockawayX Doubles Down on Crypto
 Stock Market VideosAugust 27, 2026Why Peace Is Bullish for Gold Right Now

