

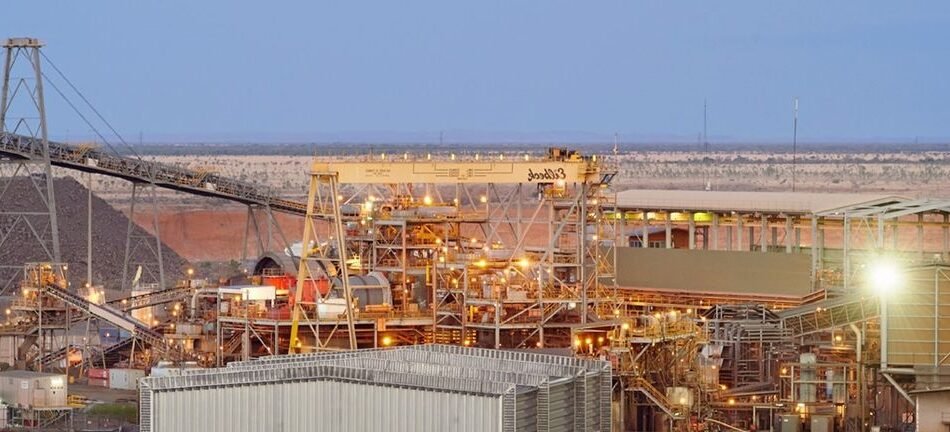
Evolution Mining stock came into today on a strong run, up about 38% over the past month and closing at A$15.07, yet the real story sits in the earnings power behind that move. The latest results headline is clear. Record underlying earnings and cash flow, with group earnings before interest, tax, depreciation and amortisation at A$3.2b and underlying net profit after tax at A$1.6b, put profitability and cash generation at the centre of the investment debate.
The short term reaction has been about momentum. The longer term question is how investors should price a miner posting a 57% earnings before interest, tax, depreciation and amortisation margin, while also lifting dividends off a higher cash flow base.
Is Evolution Mining trading at a genuine discount, or just carrying a richer multiple than the wider metals and mining group for good reason? Compare the current share price against the full valuation analysis for Evolution Mining.
FY 2026 Earnings Summary
- Total Revenue, FY 2026 vs. FY 2025: A$5,112.986m vs. A$4,351.475m (up about 17.5%)
- Net Income from Continuing Operations, FY 2026 vs. FY 2025: A$1,327.649m vs. A$926.169m (up about 43.4%)
- Basic EPS, FY 2026 vs. FY 2025: A$0.66136 per share vs. A$0.464946 per share (up about 42.3%)
- EBITDA Margin, FY 2026 vs. FY 2025: 57% vs. 52%. Net profit margin moved from 17.7% to 26% year over year, indicating stronger overall profitability.
Prefer clean charts instead of another wall of numbers and spreadsheet tabs? See Evolution Mining’s full valuation picture in a simple visual format with our company report for Evolution Mining.

Evaluating Evolution Mining’s Cash and Copper Upside Story
The bullish story around Evolution Mining is about a self funding growth engine that uses strong cash generation, tighter costs and more copper exposure to support both expansion and dividends. FY26 numbers largely back that up. Underlying EBITDA of A$3.2b, NPAT of A$1.6b and about A$1.4b of group cash flow give substance to the claim of a cash rich, low leverage balance sheet. Net cash of about A$1.4b plus undrawn facilities means current growth projects and the higher FY26 dividend of A$0.41 per share are being funded from genuine internal capacity.
The second leg of the thesis is copper as a stabiliser. Copper volumes and by product credits are already influential enough that management explicitly includes copper price assumptions in FY27 cost guidance and calls out AISC sensitivity. The Carnaby deal and Greater Duchess project indicate that this copper tilt is moving further in the intended direction.
Compare this self funding growth story and copper tilt with what the street is actually pricing in. See the consensus price target analysis for Evolution Mining to judge whether analyst targets line up with Evolution Mining’s current momentum.
Evolution Mining: Bears Focus On Cost And Execution Risks
The bearish view on Evolution Mining centres on three linked worries. Unhedged commodity exposure, rising cost inflation and heavy project spend could squeeze free cash flow if gold and copper prices soften. The latest result challenges parts of that, but does not close the case.
Record A$3.2b EBITDA and A$1.6b NPAT, a 57% EBITDA margin and A$1.4b net cash show the balance sheet is not currently stretched. Projects like Mungari coming in 15% under budget and 9 months early directly contradict fears of broad project slippage. However, management now bakes 4% to 5% cost inflation into FY27 and guides AISC to A$1,795 to A$1,995 per ounce. That validates the concern that unit costs are trending higher. Fully unhedged gold and copper exposure plus a multi year A$0.9b to A$1.1b capex envelope mean bears still have live downside scenarios if prices weaken.
After cost inflation, unhedged exposure and a heavy capex bill, the obvious worries may not be the only ones. Review our structured risk scoring to see whether Evolution Mining faces deeper financial or operational vulnerabilities in the risk analysis for Evolution Mining which shows 1 important warning sign.
Power Up Your Next Investment Decision
If Evolution Mining’s record EBITDA, strong cash position and copper exposure have caught your attention, register for free with Simply Wall St and add it to a Watchlist to track the share price against fair value and watch for your preferred entry point. Once you have taken a position, use the Portfolio Command Center to cut through noise and focus on the most important fundamental and earnings updates that affect your holdings. For longer term decisions, tap into collective insight through the Community and compare your thesis with other investors. By spotting potential catalysts and risks early, you give yourself a better chance to stay ahead of the market.
Seeking Alternatives Before The Crowd Moves
Fresh stock ideas can start breaking out while attention stays locked on Evolution Mining. Use this moment before the crowd catches on and prices move, then get in early.
This article by Simply Wall St is general in nature. We provide commentary based on historical data
and analyst forecasts only using an unbiased methodology and our articles are not intended to be financial advice. It does not constitute a recommendation to buy or sell any stock, and does not take account of your objectives, or your
financial situation. We aim to bring you long-term focused analysis driven by fundamental data.
Note that our analysis may not factor in the latest price-sensitive company announcements or qualitative material.
Simply Wall St has no position in any stocks mentioned.
Valuation is complex, but we’re here to simplify it.
Discover if Evolution Mining might be undervalued or overvalued with our detailed analysis, featuring fair value estimates, potential risks, dividends, insider trades, and its financial condition.
Have feedback on this article? Concerned about the content? Get in touch with us directly. Alternatively, email editorial-team@simplywallst.com
Source link


