


Ethereum price today: $2,510
- Ethereum reclaimed the $2,500 level after the stablecoin market cap began expanding, growing by $4.1 billion over the past two weeks.
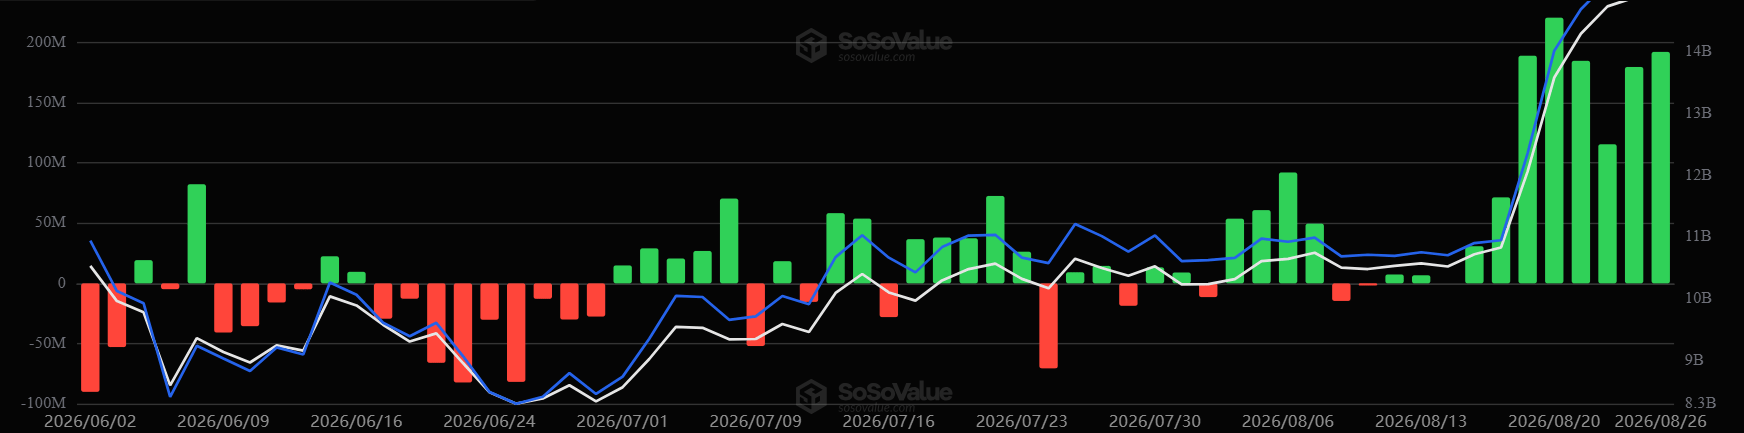
- US spot ETH ETFs have added $1.18 billion across eight consecutive days of net inflows.
- ETH is consolidating above the $2,430 support.
Ethereum (ETH) reclaimed $2,500 on Thursday following an expansion in stablecoin supply and exchange-traded funds (ETFs) inflows.
Stablecoin growth and ETH ETFs inflows fuel rally
The total stablecoin market cap has increased by roughly $4.1 billion over the past two weeks. From that figure, $2.37 billion came in the past seven days.
The growth marks its first two-week expansion since mid-May, when the crypto market fell nearly 30% after a brief bear-market rally. Between mid-May and August 11, the stablecoin market contracted by roughly $16.1 billion.
Increased stablecoin inflows indicate new money is flowing into the crypto market, providing investors with more buying power. Outflows show investors are leaving the market after potentially booking profits/cutting losses.
While money is flowing into the crypto market through native crypto investors, traditional investors have also flipped bullish. US spot ETH exchange-traded funds (ETFs) have pulled in $1.18 billion in net inflows over eight consecutive trading days, their longest positive streak since April and largest eight-day flow since October, according to SoSoValue data.
In addition, staked ETH has continued its uptrend, reaching 42.4 million ETH, representing 34.7% of total supply, per Ultrasound Money data.
Ethereum technical analysis: ETH consolidates above $2,430
Ethereum recorded $122.9 million in liquidations over the past 24 hours, driven by $77 million in short liquidations, per Coinglass data.
On the daily chart, ETH retains a bullish near-term bias as price holds well above both long- and short-term Exponential Moving Averages (EMAs), reinforcing a broad constructive structure.
However, momentum readings are stretched, as the 14-day Relative Strength Index (RSI) hovers in overbought territory near 77 and the Stochastic Oscillator (Stoch) climbs above 90, hinting that upside could be vulnerable to a corrective pause despite the firm underlying trend.
On the downside, immediate support is at the recent horizontal pivot around $2,432, with deeper support from the clustered short-term averages near $2,223 and the $2,172–$2,151 band, ahead of the mid-range EMA supports at $2,043 and $2,005.
On the topside, ETH faces initial resistance at $2,744, followed by a higher barrier at $2,883, where a clear daily close above the former would open the way for a fresh leg higher. A failure to overcome these caps would keep the focus on whether buyers can defend the support stack below $2,500.
(The technical analysis of this story was written with the help of an AI tool. Know more.)
Source link
Author

- Ytv Market News
- Share-market news writer and analyst with deep experience covering equities, commodities, forex, and cryptocurrencies for readers in the USA, UK, Canada, and Australia. Ytv Market News delivers timely market updates, practical trading insights, and clear explanations of macro and company-level catalysts that move prices. Combines on-the-ground financial reporting with technical analysis, using concise charts and actionable ideas to help investors and traders make smarter decisions.
Latest entries
 UsaAugust 28, 2026HUTCHMED Announces China NMPA Conditional Approval of ATLED for FGFR2 Fusion-Positive Intrahepatic Cholangiocarcinoma
 Crypto NewsAugust 28, 2026Justin Sun is suing a movie actress for not giving him her eggs
 Investing InsightsAugust 28, 2026Hyundai Mobis Launches ₩500 Billion Win-Win Guarantee Program to Close Financing Gaps for Suppliers — BigGo Finance
 GermanyAugust 28, 2026Nvidia ignites chip stock rally as forecast shows AI boom is intact


