


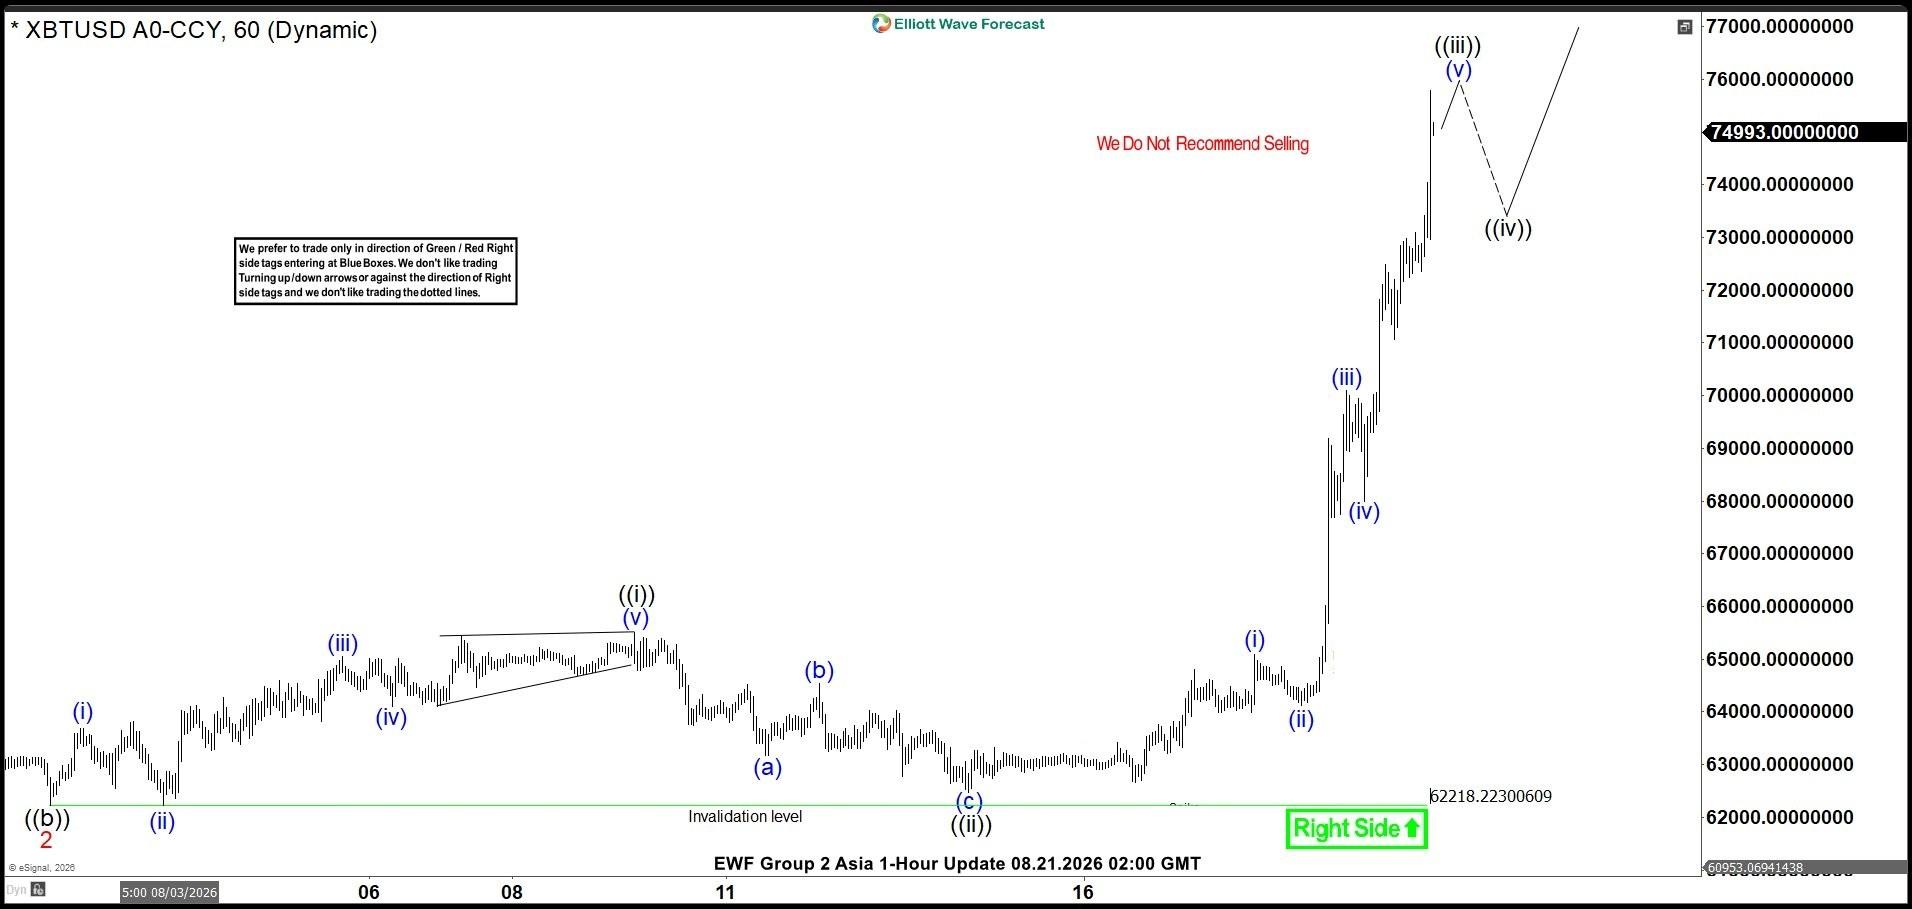
The short‑term Elliott Wave view in Bitcoin (BTCUSD) indicates that the cryptocurrency established a significant low on June 25, 2026. From that level, price action began to unfold with impulsive characteristics. The initial advance completed wave 1 at $66,990, followed by a corrective pullback in wave 2 that ended at $62,214.75. Momentum then shifted upward again, as reflected in the one‑hour chart. From wave 2, wave ((i)) concluded at $65,510, while the subsequent retracement in wave ((ii)) found support at $62,470.
The structure has continued to develop with internal subdivisions forming another impulse of lesser degree. From wave ((ii)), wave (i) terminated at $65,080, and the corrective phase in wave (ii) ended at $64,112.8. Bitcoin then extended higher in wave (iii), reaching $70,089, before a modest decline in wave (iv) concluded at $67,993.4. The market is now progressing toward completion of wave (v) within wave ((iii)). Once this final leg concludes, a corrective pullback in wave ((iv)) is anticipated before the broader rally resumes.
Near term, the critical pivot remains at $62,218.2. As long as this level holds, corrective phases are expected to find support within a three‑ or seven‑swing structure, setting the stage for further upside. The overall sequence suggests that Bitcoin retains bullish potential, with dips likely to attract buyers. This reinforces the view that the impulsive cycle from the June 25 low remains intact, and the market should continue to advance once the current corrective phase completes.
Bitcoin (BTC/USD) 60-minute Elliott Wave chart
BTC/USD Elliott Wave [Video]
Source link
Author

- Ytv Market News
- Share-market news writer and analyst with deep experience covering equities, commodities, forex, and cryptocurrencies for readers in the USA, UK, Canada, and Australia. Ytv Market News delivers timely market updates, practical trading insights, and clear explanations of macro and company-level catalysts that move prices. Combines on-the-ground financial reporting with technical analysis, using concise charts and actionable ideas to help investors and traders make smarter decisions.
Latest entries
 Forex NewsAugust 24, 2026Canada’s Carney: Retaliatory tariffs will start September 8
 IndiaAugust 24, 2026Stock market today: Nifty, Sensex may open weak on global cues
 Company Press ReleasesAugust 24, 2026AcuCort appoints Carl Frisk as Strategic Alliance Manager
 Company NewsAugust 24, 2026Lumentum Aktie: Umsatz wächst um 109 Prozent


