

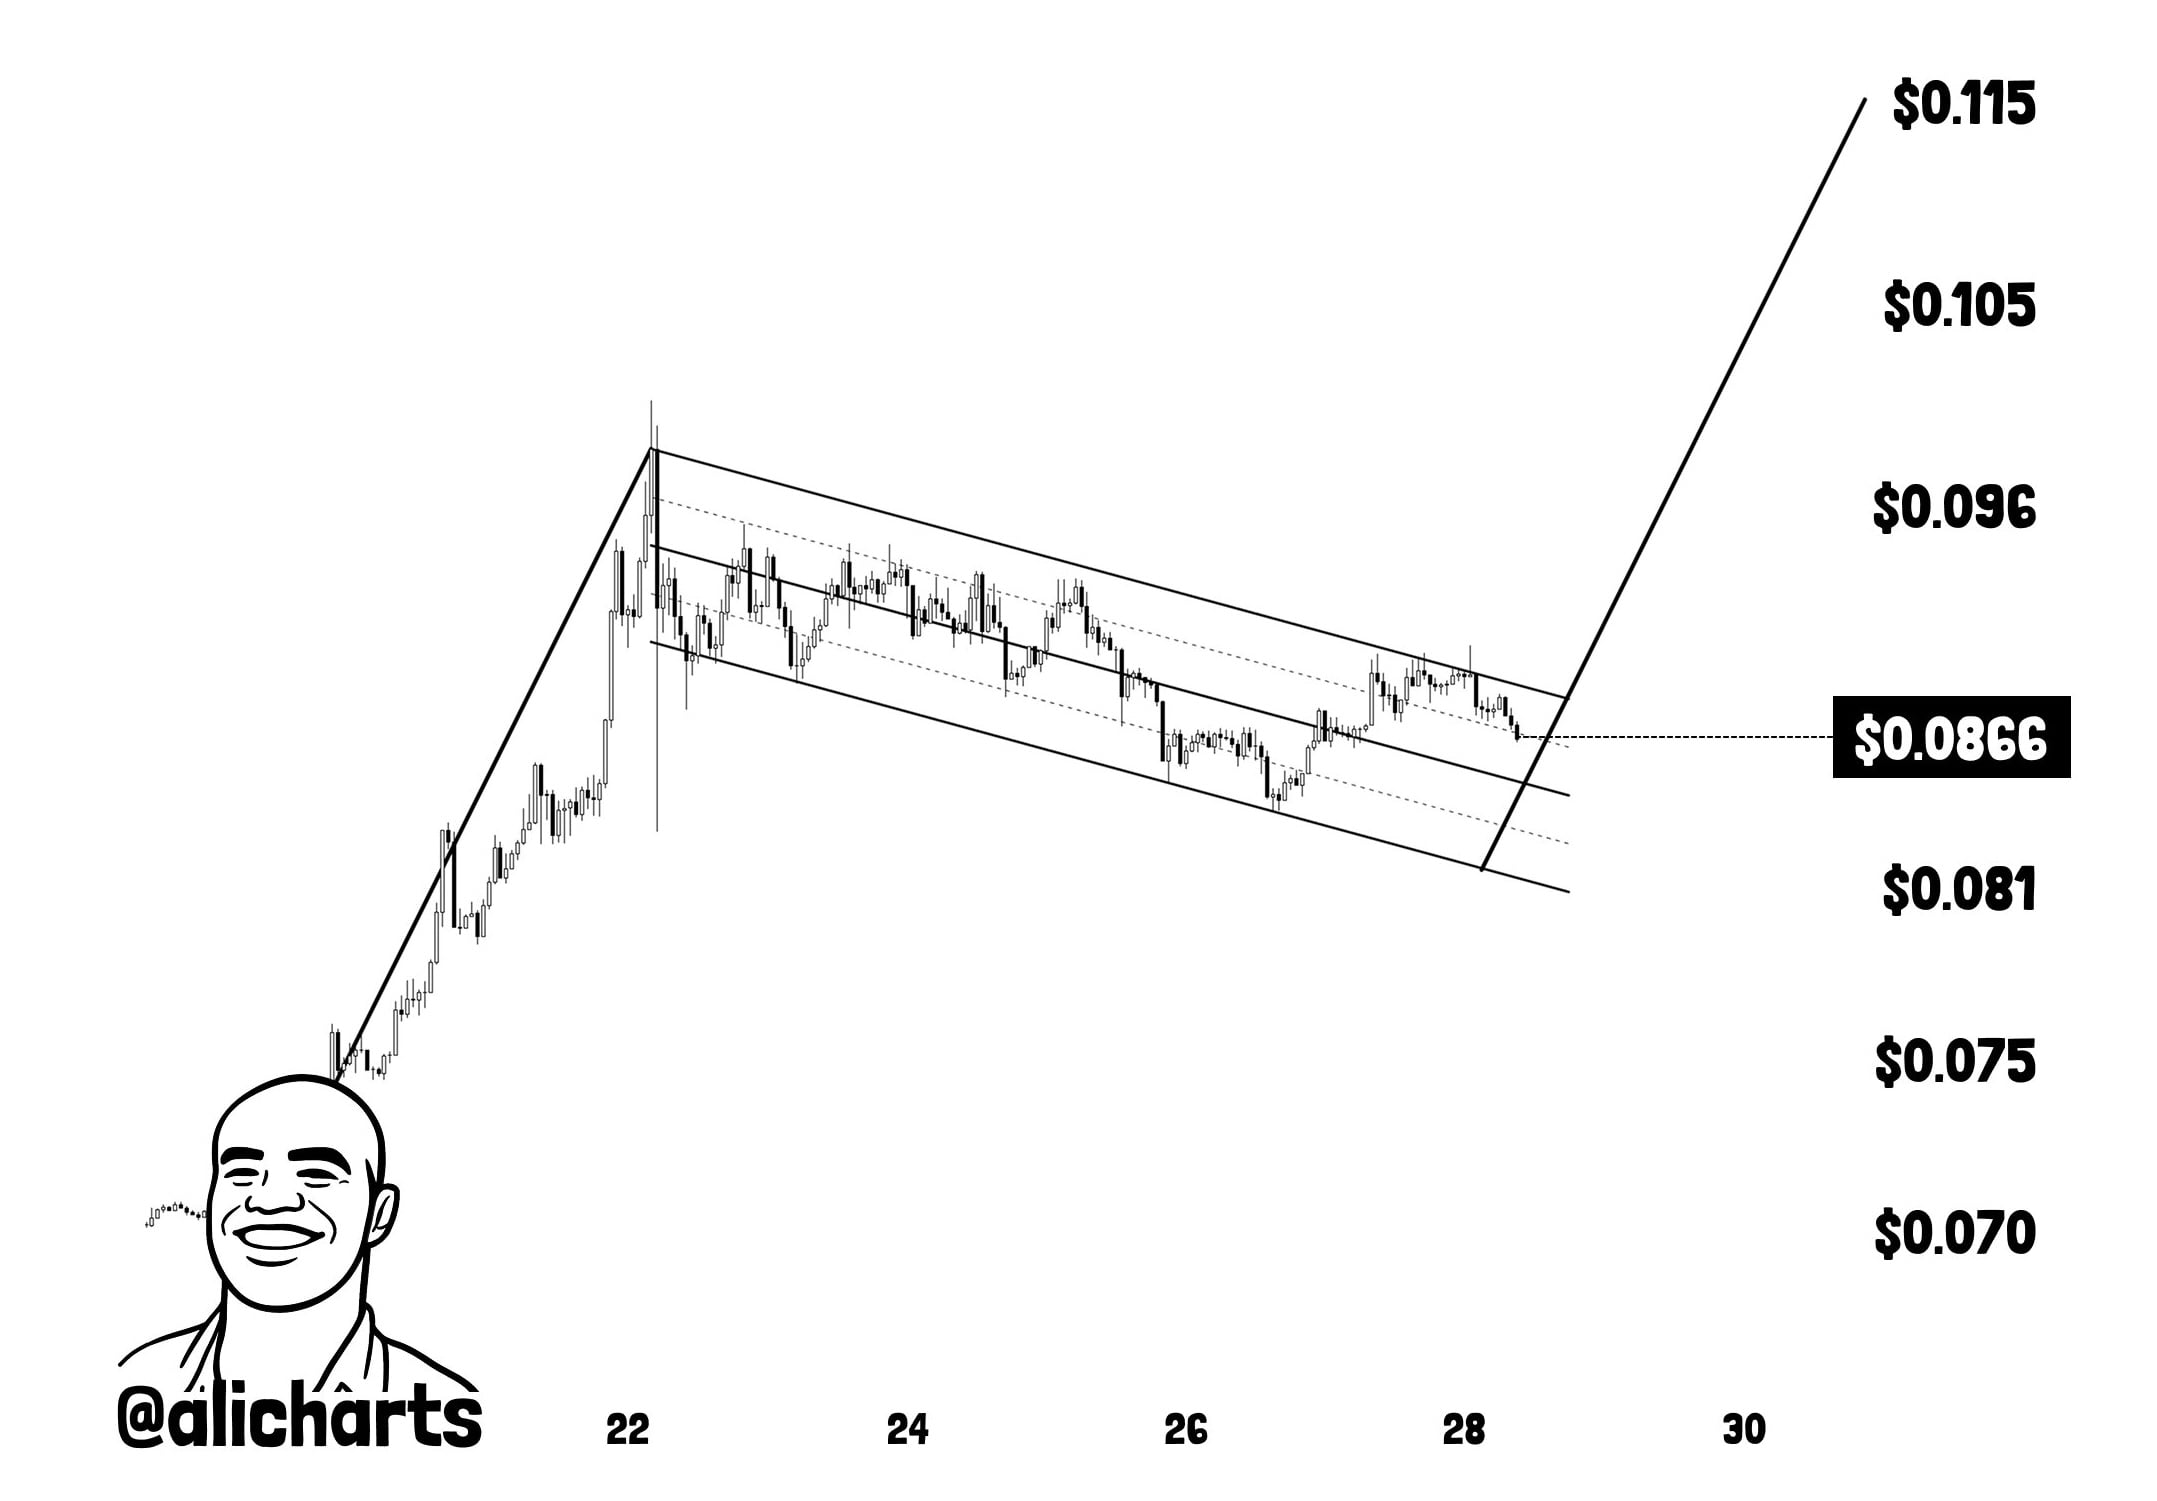
Dogecoin’s (DOGE) current price action has once again brought the coin into focus amid active market demand. After its recent vertical surge, DOGE moved into a narrow range, forming a Bullish Flag pattern on the hourly chart.
Prominent crypto analyst Ali Martinez believes this pattern could increase the token’s price by one-third.
What happens next for DOGE: Two scenarios
DOGE is currently trading within a narrow range of $0.087–$0.088, and Martinez divides the possible next move into two clear scenarios:
- Bullish scenario: An hourly candle close above the $0.090 resistance level would officially activate the pattern. This would open the way toward the nearest target at $0.115, representing a clean upside of around 30%. Above $0.090, historical sell-order density is virtually nonexistent all the way to $0.177, clearing the way for a rapid price move.
- Bearish scenario: A break below $0.081 would completely invalidate the bullish flag setup. In this case, sellers would regain control, and the price could correct toward the long-term bottom of the broader descending wedge in the $0.056–$0.060 range.
The main technical factor working against a deeper decline is the strong on-chain foundation. The $0.081 level has seen enormous trading activity, with around 30 billion DOGE previously changing hands there.
This massive amount of accumulated capital acts as a strong support zone capable of holding the price during local market pullbacks.
You Might Also Like
Nevertheless, the broader picture continues to show resistance on higher time frames. The local flag is developing within a larger descending wedge on the daily chart. DOGE recently attempted to break through the psychological barrier at $0.10 but encountered resistance from the 200-day EMA at $0.095.
The final days of August will determine whether enough volume enters the order book to trigger the breakout or whether Dogecoin has entered a prolonged consolidation phase within the broader range.
Source link
Author

- Ytv Market News
- Share-market news writer and analyst with deep experience covering equities, commodities, forex, and cryptocurrencies for readers in the USA, UK, Canada, and Australia. Ytv Market News delivers timely market updates, practical trading insights, and clear explanations of macro and company-level catalysts that move prices. Combines on-the-ground financial reporting with technical analysis, using concise charts and actionable ideas to help investors and traders make smarter decisions.
Latest entries
 Credit Cards USAAugust 28, 2026Chase Cardholders Can Score New Perks at Miami Heat Games
 UsaAugust 28, 2026Prediction: Applied Digital Stock Will Jump 156% in 3 Years. Here’s the Math.
 AustraliaAugust 28, 2026Buy, hold, sell: Ramsay Health Care, PLS Group, Woolworths shares
 Crypto NewsAugust 28, 2026Zcash price targets $840 as bullish trend holds


