

![Classical Auto Chart Patterns [AFD] — Indicator by AuctionFoundry — TradingView](https://ytvmarketnews.com/wp-content/uploads/2026/08/g5uim9n5_big-950x500.png)
Fifteen classical chart patterns, drawn automatically off confirmed pivots. When one completes, its label reads what price did — not what the textbook hoped. A bullish-named shape that breaks down is labelled Rectangle · Closed Below, not Bearish Reversal.
Reading the label
Every reading starts with Conventionally. That word is literal: it’s what the textbook says about the shape’s name, not what this script thinks about your chart. Then two plain ideas — which way the textbook reads the shape (Bullish, Bearish, or Two-Sided when it won’t call one), and what kind of move it files the shape under (Continuation is a pause inside an existing move; Reversal is a turn).
- []Conventionally Bearish Reversal · Rising Wedge []Conventionally Two-Sided Continuation · Rising Channel
- Conventionally Two-Sided · Rectangle — won’t say either way
Those same two ideas are filters in the settings, read from the same grouping as the label — so the panel and the chart can’t disagree about what a formation is.
What it draws
Fifteen formations, off confirmed pivots only:
- Channels and wedges, rising and falling, each fitted to two boundaries Triangles — ascending, descending, symmetrical []Rectangles, flags and pennants — flags and pennants need a prior move, and stop being named once the pause runs too long to be brief Neckline reversals — double top and bottom, head & shoulders and its inverse, each drawn through its own extrema with its neckline
Once an anchor is placed, it never moves.
Three things here that are unusual
1. Expired formations stay on the chart. A shape that ran past its apex, drifted out of the width band that let it be named, or outlived the swings that defined it is drawn dim and dashed, right beside the ones that completed. Showing only what completed is a survivorship filter on the evidence in front of you. It ships off (Expired formations kept = 0, to keep a fast intraday chart clean) — turn it up and they’re back.
2. The reading is attributed, not endorsed. That Conventionally prefix isn’t politeness. On AMEX:SPY 2m over 1,549 bars at default settings, across the 58 formations that completed, price ran no further with the completing close over the next 20 bars than against it. One instrument, one timeframe, chart history — not a forecast. The script reports what the literature says about the name. It doesn’t endorse it, and it doesn’t tell you what to do.
3. Nothing is scored or ranked. No formation carries a grade, a strength value or an ordering against another — not on a drawing, not in the table. Shapes are compared in exactly one place, and it’s a setting you control: when more qualify than there are draw slots, the By dropdown decides which get drawn. That comparison never reaches a label and says nothing about a formation’s quality.
On the chart
Three states you can tell apart at a glance. Forming is solid and runs to the right edge. Completed is dotted and stops at the bar a close finished beyond a boundary. Expired is dim and dashed.
Entry, Target and Stop levels are drawn when a formation completes. Entry is that completing close. Up to three targets sit at your own multiples of R and ship at 0.25R, 0.5R and 1R. The Stop ships at the formation’s own opposite boundary read on the completing bar — or, on a neckline pattern, the far peak or trough it’s built on — with a fixed-R option if you prefer. R is the formation’s own height, capped at your multiple of recent daily range. These are your settings drawn as geometry. They measure nothing about outcomes. A level can record that a bar traded to its price, on its own label; an unmarked level means only that no bar has reached it yet — never that it failed.
Gate levels on % Complete ships off, so every completion gets levels. Switch it on and only completions inside a % band you set are given levels — the rest are still detected, named, tabled and alerted, just without levels.
A corner table lists the completed formations still on the chart — name, conventional reading, and the same prices the labels carry, read from the same frozen fields. Two alerts fire on a bar’s close, not on a wick through a line: a formation is admitted, and a formation completes.
Late by design — how it behaves live
This draws off confirmed pivots only. A pivot isn’t confirmed until Swing strength bars have closed past it, so a formation appears that many bars after the pivot that anchors it — and because each boundary is drawn back to its anchors, the finished chart shows a line on bars where it hadn’t been drawn yet. The left end of every boundary means “confirmed later,” not “known then.” On history the whole formation is there the moment you load it; live, it appears some bars after its anchors print. TradingView classes pivot-based scripts as potentially misleading for exactly this reason, and this one is in that category.
It draws into the past but never revises a drawing in place. Stepped through Bar Replay one bar at a time over 150 bars of NASDAQ:AAPL 1m: 183 boundaries each held one contiguous run of frames — none altered, none vanishing and returning — and 22 completed labels never moved or changed text. Replay hands over whole closed bars, so nothing here is claimed tick by tick. One value comes from a higher timeframe — a daily range that caps how far a level can project — requested as the previous completed daily bar with barmerge.lookahead_on, the pairing that does not repaint. Nothing else reads a timeframe other than your own.
Settings worth knowing
- []Swing strength sets the scale — higher means fewer, larger formations and a longer wait for each. It stays editable under every preset. []Preset — Strict, Balanced or Permissive — is how cleanly a shape has to fit its anchors. It says nothing about how shapes resolve. []Draw formations while they are forming is off by default, so a fresh chart opens showing formations that have already ended. []Completed / Expired formations kept are recency windows, not contests — worth turning up before you conclude a family is missing.
Credit
The boundary-validity geometry — same-side anchors, no bar piercing the line between them, nothing violating it since — is my own earlier work, open source and public as Auto Trendlines [AFD]. The formation layer here is built on top of it.
Licence
Open source under the Mozilla Public License 2.0. © Auction Foundry
Source link
Author

- Ytv Market News
- Share-market news writer and analyst with deep experience covering equities, commodities, forex, and cryptocurrencies for readers in the USA, UK, Canada, and Australia. Ytv Market News delivers timely market updates, practical trading insights, and clear explanations of macro and company-level catalysts that move prices. Combines on-the-ground financial reporting with technical analysis, using concise charts and actionable ideas to help investors and traders make smarter decisions.
Latest entries
 Commodities NewsAugust 25, 2026China Defies U.S. Economic D-Day against Iran
![[Bank of Montreal Q3 2026 Earnings Call] BMO Posts Record CAD 2.9B Net Income, Lifts ROE to 14% on 22% EPS Jump; CEO Says Tariff Impact ‘Absolutely Manageable’](https://ytvmarketnews.com/wp-content/uploads/2026/08/aHR0cHM6Ly9pbWcuYmdvLm9uZS9uZXdzLWltYWdlL2Vhcm5pbmdzX2NhcmQvMjAyNi0wOC9VU19CTU9fMjAyNi0wOC0yNV8xNzg3.webp) Investing InsightsAugust 25, 2026[Bank of Montreal Q3 2026 Earnings Call] BMO Posts Record CAD 2.9B Net Income, Lifts ROE to 14% on 22% EPS Jump; CEO Says Tariff Impact ‘Absolutely Manageable’
Investing InsightsAugust 25, 2026[Bank of Montreal Q3 2026 Earnings Call] BMO Posts Record CAD 2.9B Net Income, Lifts ROE to 14% on 22% EPS Jump; CEO Says Tariff Impact ‘Absolutely Manageable’ GermanyAugust 25, 2026Google expands Gemini Enterprise AI platform for law firms, lawyers
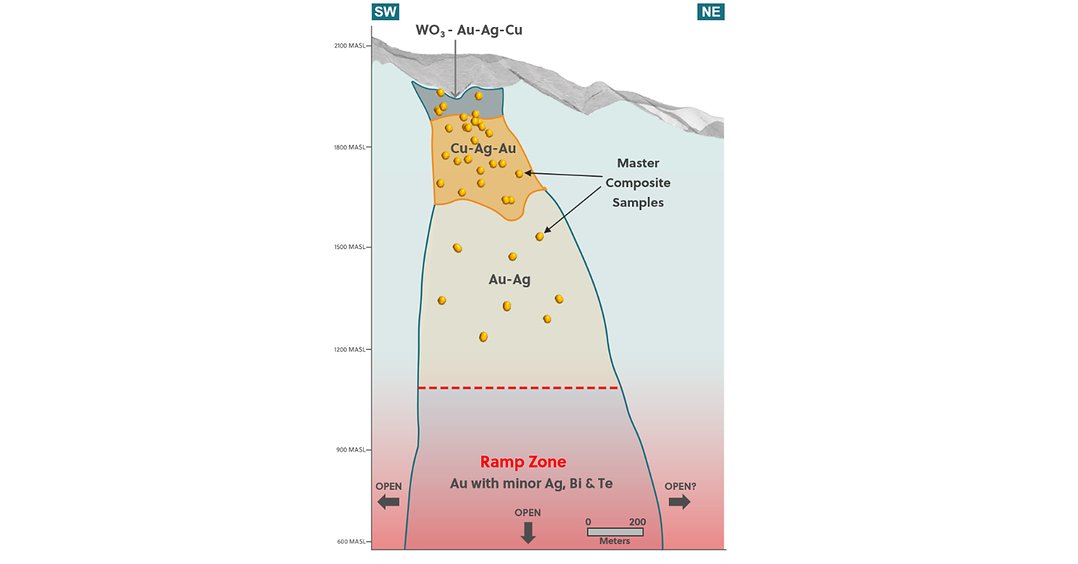 CanadaAugust 25, 2026Collective Mining Reports Robust Metallurgical Recovery Rates at Apollo: 95% Gold, 92% Silver, 85% Copper and 70% Tungsten; Initial Mineral Resource Estimate Targeted for September 2026

