


The 365-day moving average around $83,000, which may prove to be one of Bitcoin’s most significant technical tests, is now within striking distance of the asset thanks to its comeback. Bitcoin is currently trading between $80,000 and $81,000 after an incredible comeback from the $63,000 to $64,000 range.
Even more challenges to come
Several significant moving averages, including the long-term trend line close to $71,850, have already been crossed by Bitcoin on the daily chart. The next significant challenge is just a few thousand dollars away. The 365-day moving average is estimated to be around $83,057 by CryptoQuant.
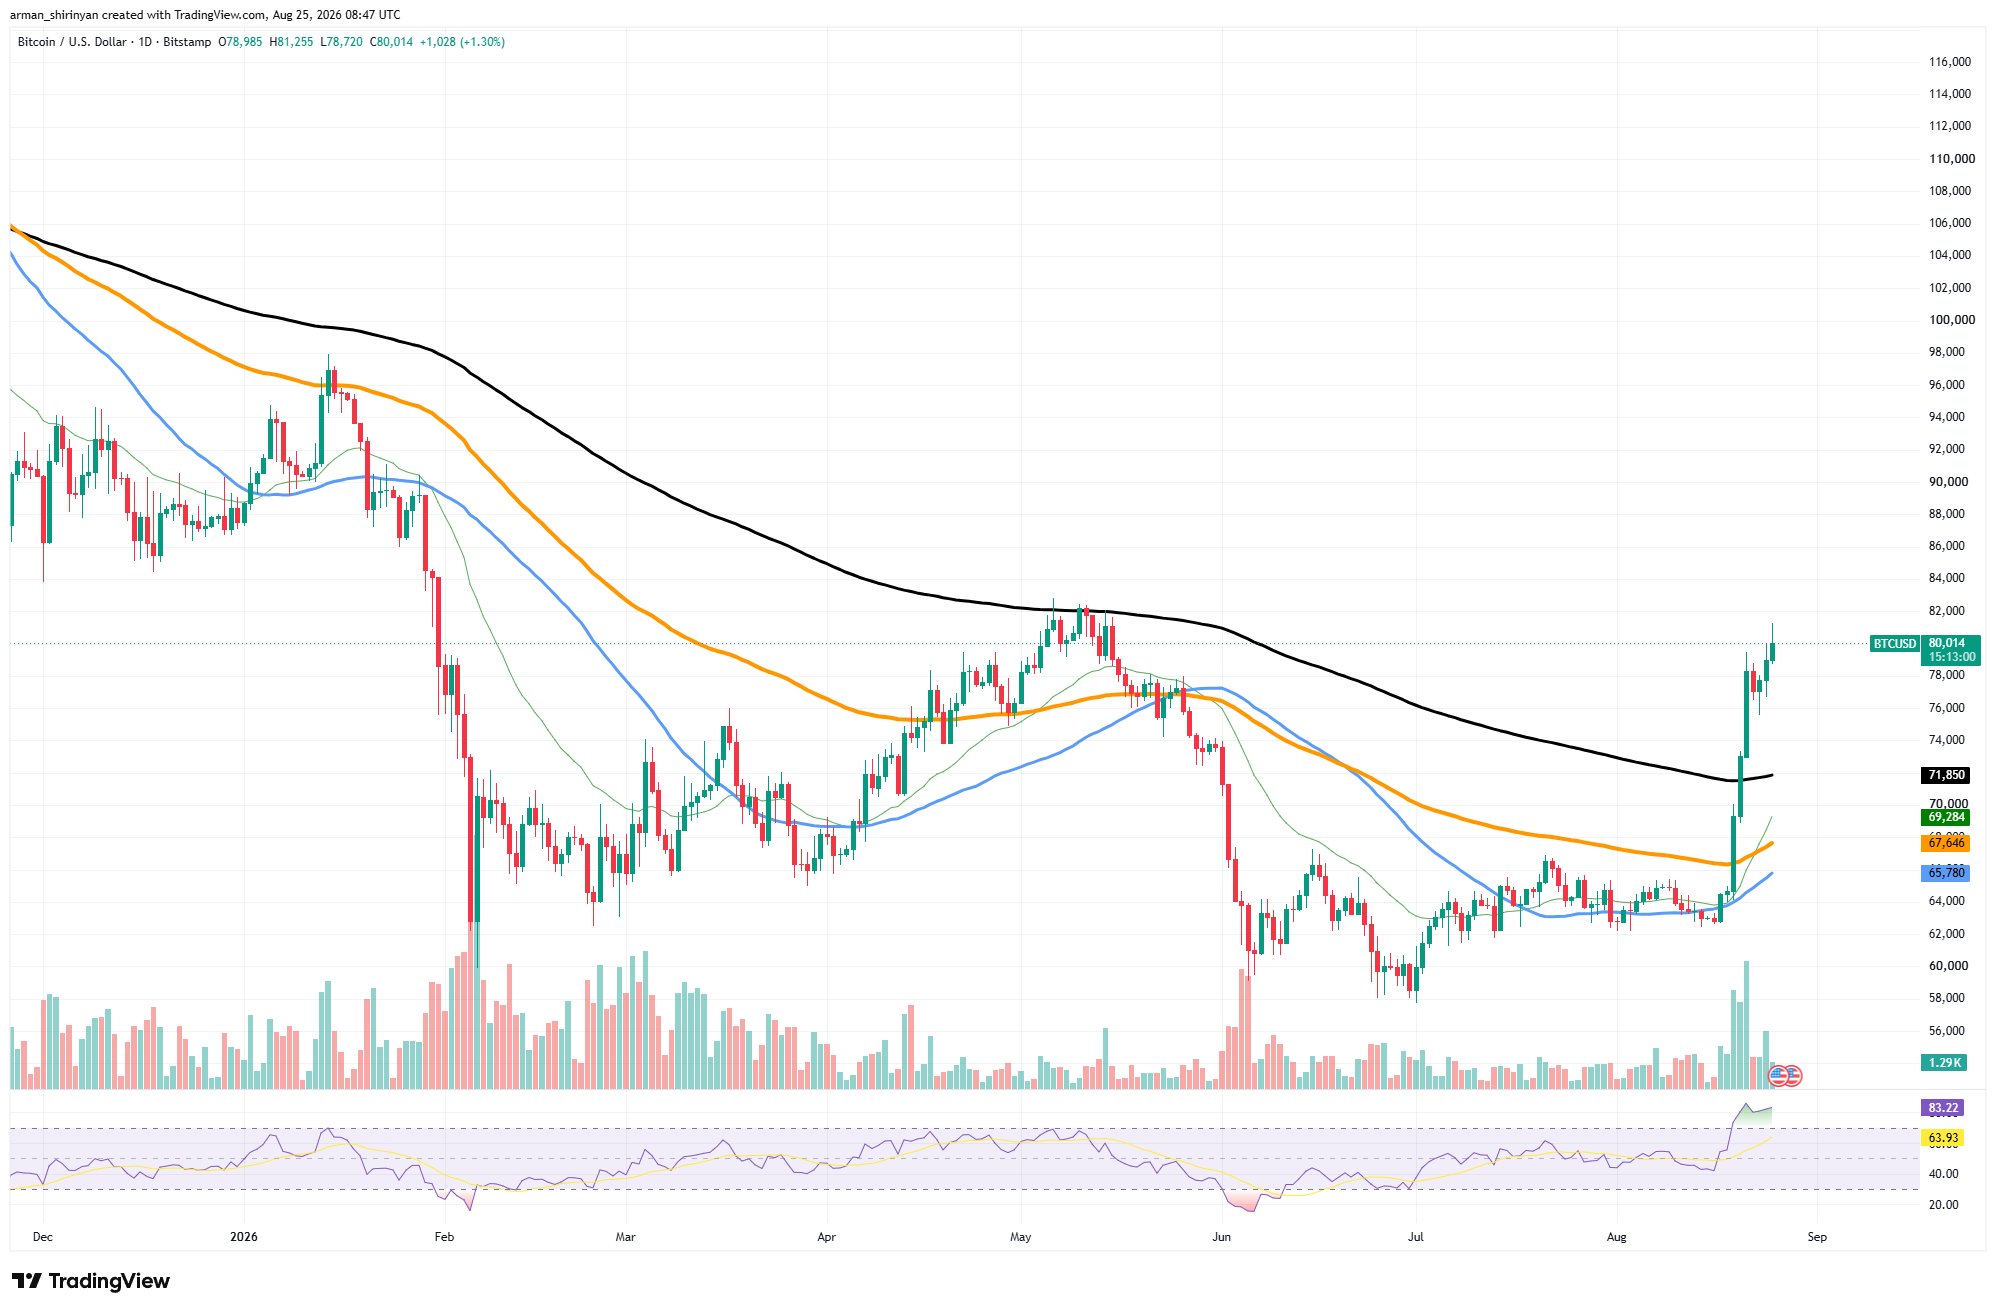
Because Bitcoin is currently trading below its annual average price, this level merits special attention. Therefore, recovering it would be a much stronger trend signal than breaking a level of short-term resistance. Additionally, the historical chart explains why $83,000 can be considered the “final boss” for Bitcoin right now.
In the past, the 365-day average was a crucial barrier separating broader bullish and bearish structures. During its significant drop, Bitcoin lost the average and has not yet risen above it. However, there is a lot of risk involved in the immediate setup. The daily RSI for Bitcoin has increased to about 83, indicating that the market is well inside overbought territory.
Bitcoin cooldown is closer
Additionally, Bitcoin has increased from about $64,000 to $80,000 with minimal consolidation. As a result, buyers might find it difficult to get past another significant technical obstacle right away. At this point, three scenarios stand out. A daily breakout above $83,000 followed by consolidation above the 365-day average would be the best outcome.

That would pave the way for a price between $85,000 and $90,000 and significantly bolster the claim that Bitcoin’s overall trend has turned around. Instead, a cooldown toward $76,000–$78,000 would become more likely if $83,000 were rejected. The new bullish structure would still be compatible with such a retracement.
If Bitcoin loses the recovered long-term support at $71,800, the more detrimental scenario begins. This would reopen the possibility of movement toward the upper $60,000 range and make the most recent vertical rally a far less convincing breakout.
The majority of the challenging work has so far been completed by Bitcoin. The 365-day average is the point at which the recovery may grow into something much more significant.
Source link
Author

- Ytv Market News
- Share-market news writer and analyst with deep experience covering equities, commodities, forex, and cryptocurrencies for readers in the USA, UK, Canada, and Australia. Ytv Market News delivers timely market updates, practical trading insights, and clear explanations of macro and company-level catalysts that move prices. Combines on-the-ground financial reporting with technical analysis, using concise charts and actionable ideas to help investors and traders make smarter decisions.
Latest entries
 UsaAugust 25, 2026Press Release: Hal Rogers Announces Funding for Police Communications Upgrades in Southern and Eastern Kentucky
 Crypto NewsAugust 25, 2026Bullish Analyst Tom Lee Speaks Out: “This Latest Move by the U.S. Treasury Department Is for Cryptocurrencies…”
 Commodities NewsAugust 25, 2026JPMorgan and Santander Lead $15 Billion Financing Push for Argentina LNG
 Investing InsightsAugust 25, 2026Dow extends gains, up 140 points as oil slump eases inflation fears; semis in wait-and-see mode — BigGo Finance


