


Ether (ETH) has outperformed Bitcoin over two months and the trend looks set to continue, with a “golden cross” having recently formed on the ETH/BTC ratio.
The crossover is identified when an asset’s rolling 50-day average price surpasses its 200-day average. It’s said to reflect a short-term trend outperforming the longer-term trajectory, with the potential to evolve into a full-blown bull run.
The latest crossover in the ETH/BTC ratio suggests just that. Its appearance comes after an already buoyant stretch for ether, which has been outperforming bitcoin since early June. The pair has rallied 25% since the June 6 bottom.
Crossovers, however, are built entirely from past price action, not a forward-looking read on what comes next. Think of them as a thermometer: it tells us the market’s present temperature, not tomorrow’s forecast. The logic underneath a golden cross leans on a simple assumption, that an object in motion stays in motion until an outside forces acts upon it, meaning if the averages are rising, the trend is up, the momentum should persist. That assumption doesn’t always hold, which is why these signals are not always reliable and have well-documented limits.
Golden crosses have a mixed record on the ETH/BTC ratio specifically some have paid off, others have failed, trapping bulls on the wrong side of the market.
The most recent one, on July 25, 2025, initially delivered. The ratio rallied 36% over the following four weeks before reversing into a much steeper downtrend. The February 2021 golden cross fared remarkably better, fueling a 93% rally that took the ratio to 0.0824 by mid-May 2021. But the crosses that appeared in May 2022 and August 2022 turned out to be bull traps, with the ratio falling almost immediately after each one formed.
Source link
Author

- Ytv Market News
- Share-market news writer and analyst with deep experience covering equities, commodities, forex, and cryptocurrencies for readers in the USA, UK, Canada, and Australia. Ytv Market News delivers timely market updates, practical trading insights, and clear explanations of macro and company-level catalysts that move prices. Combines on-the-ground financial reporting with technical analysis, using concise charts and actionable ideas to help investors and traders make smarter decisions.
Latest entries
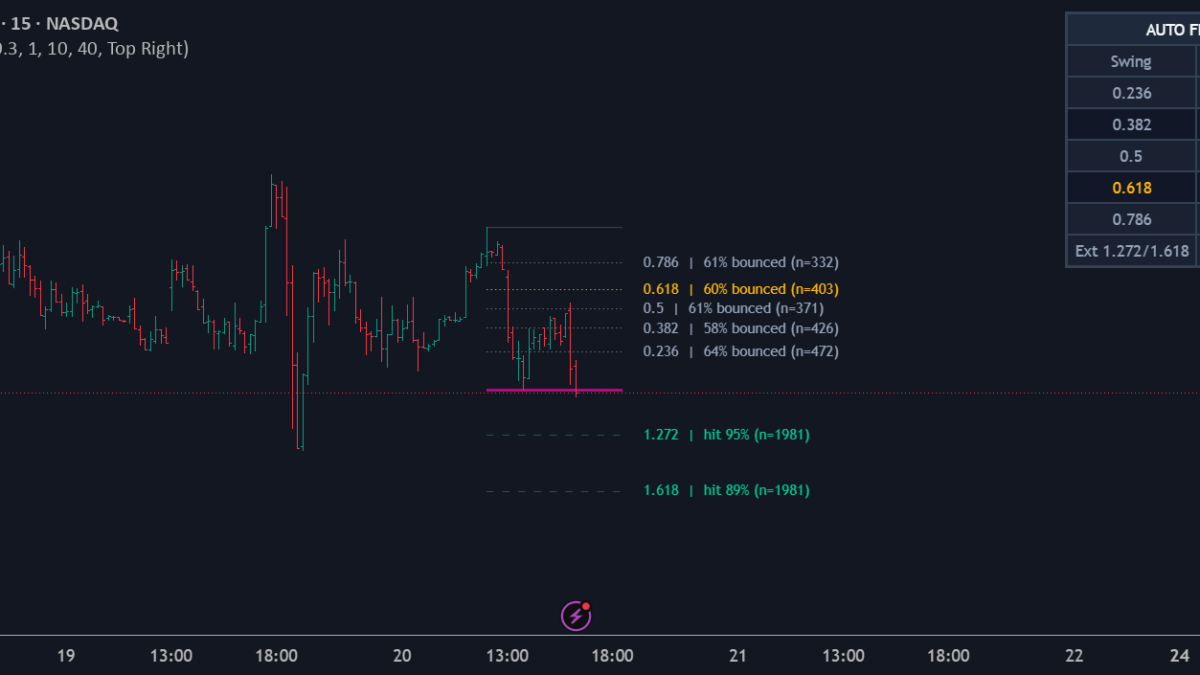 Trading IndicatorsAugust 24, 2026Auto Fibonacci AI – Level Respect Statistics [Dots3Red] — Indicator by Dots3Red — TradingView
 UkAugust 24, 2026Nvidia Earnings, Iran Sanctions and Fed Outlook Drive Market Caution: Dow Jones, S&P, Nasdaq, Wall Street Futures
 AustraliaAugust 24, 2026Adore Beauty Group Looking for Profit Step-Up after Record FY26 Revenue
 UsaAugust 24, 2026Social Security COLA Estimate for 2027 Slips as Inflation Cools — Here’s What It Means for Your Check


