

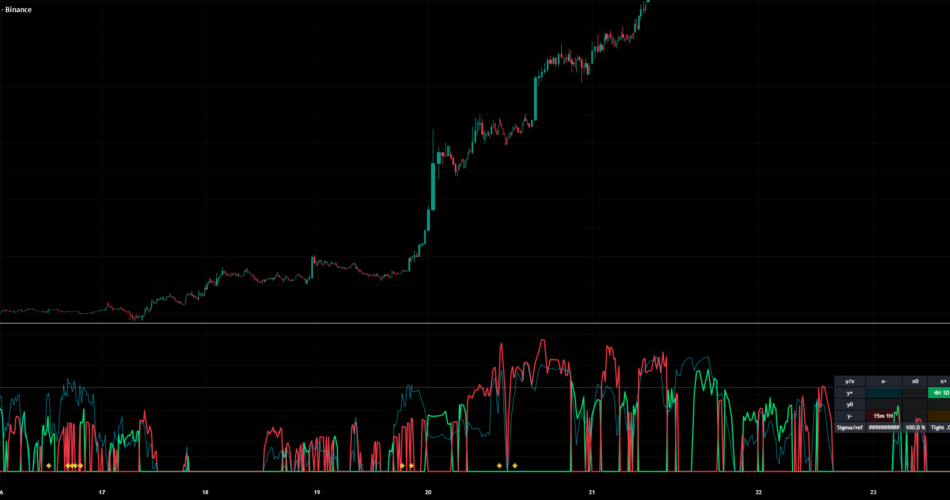
WHAT IT DRAWS
Each of four timeframes (15m, 1H, 4H, 1D by default) becomes a point on a plane: x is RSI minus 50 over 50, y is Stochastic %K minus 50 over 50. Four points, one plane, all bounded to the same square.
From those points it computes a weighted centroid, the weighted dispersion around it, and three terms that are fused as a geometric mean: Tight (how small the dispersion is against a reference), Dir (how much the four timeframes agree on rotation direction, clockwise counting as bull) and Mag (how far the centroid sits from the origin). The fusion is evaluated as a bull and a bear score, because a geometric mean of a signed quantity is undefined. A 3×3 map shows which cell the centroid occupies, with a gauge for dispersion against the reference, and a diamond marks a bar where a timeframe crossed a quadrant boundary while the cluster was tight.
WHAT THE MEASUREMENT FOUND
None of the states separate from chance.
Testing all seventeen states this dashboard advertises at once – counted as episodes rather than as overlapping bars, against 500 circular shifts of the forward-return series – the largest standardised effect anywhere in the family is 1.76, 1.37 and 1.54 at horizons of 4, 16 and 96 bars, against a null that averages 2.11, 2.07 and 1.95. The family-wise p-values are 0.689, 0.936 and 0.838. The dashboard is less extreme than a randomly misaligned copy of itself, and the same test fails in all twelve instrument-by-timeframe-by-horizon cells.
One result did not die, and it is worth stating precisely because the tempting version of it is wrong. Bars where Tight is at or above 0.50 are followed by larger absolute moves on BINANCE:BTCUSDT 15m: measured at episode level, the four-bar-forward absolute return is 1.227 times the baseline, z = 1.91, p = 0.040, over 134 episodes. Counted per bar it looks stronger – 1.269 times, p = 0.004 – but that number counts 951 overlapping bars belonging to those same 134 episodes, so it is the weaker statistic that is honest. It is a statement about the size of moves, not their direction, on one instrument, at p just under 0.05.
There is a third thing that looks like a finding and is not. The four timeframes’ points do cluster far more tightly than a null that rotates each timeframe to an unrelated point in time – z of 3.8 to 6.1 across four instrument-and-timeframe cells. That null is not one anybody should believe: the four legs are nested views of the same price series, so they agree by construction, and a random walk passes the same test. It is arithmetic about multi-timeframe indicators in general, not evidence about this one.
No edge is claimed. There is no forward-return figure here presented as a signal, and the alerts say in their own text that they describe geometry rather than predict anything.
THE SETTING THAT GOVERNS EVERYTHING
Sigma reference for Tight, default 0.50, is the master gain, and the default sits on the edge of the data. Tight is one minus dispersion over that reference, clipped at zero, so the reference decides how often the whole fusion score exists at all. Measured over 5,984 scored bars of BTCUSDT 15m the median dispersion is 0.414 – 83% of the reference – which puts median Tight at 0.180 and pins Tight, and therefore both scores, at exactly zero on 27.3% of bars. On ETHUSDT it is 21.6%. Drop the reference to 0.40 and the median score is zero; raise it to 2.0 and the median more than doubles. Anyone changing that one number is changing what every other number here means.
The score threshold at 0.55 is selective but reachable: the higher of the two scores clears it on 377 bars of the 5,984, producing 31 bull and 65 bear crossings on BTCUSDT, and 370 bars with 41 and 58 crossings on ETHUSDT. Quadrant-shift diamonds appear 163 times.
WHAT THE MEASUREMENTS COVER
The 15m results run from 2026-06-21 to 2026-08-23, 62 days, in a market that rose about 18% over the window. The 1H results reach back to 2026-04-20, about 125 days. Nothing here was tested outside that window, in a falling market, or on a non-crypto instrument.
HOW THE NUMBERS WERE CHECKED
The whole computation – the two oscillators per timeframe, the higher-timeframe mapping, the centroid and dispersion, the hysteresis on the quadrant bands, the rotation test and the fused scores – was reimplemented outside Pine and cross-checked against this chart’s Data Window on ten bars, including one carrying a quadrant-shift marker so the event path was exercised rather than assumed. All fifty values round to the exact three decimals TradingView prints. The bull and bear scores were also confirmed to be mutually exclusive on all 6,000 bars, which is structural rather than coincidental.
WHAT CHANGED IN THIS VERSION
A phase audit table promised by the settings and by five helper functions did not exist anywhere in the file; the promise was deleted rather than the table built. The 3×3 quadrant map, which is real, stays. The header carried two lineage claims – an inherited “DNA” from another indicator and a reference to a private specification – that told a reader nothing, and they are gone. An MPL header was added and a leftover compile-sentinel plot removed. The two threshold inputs now carry the measurements above in their tooltips, and the alert messages say plainly that they describe geometry. No computation changed.
Open source under MPL 2.0. Nothing here is a forecast, a signal service, or a claim of profitability.
Source link
Author

- Ytv Market News
- Share-market news writer and analyst with deep experience covering equities, commodities, forex, and cryptocurrencies for readers in the USA, UK, Canada, and Australia. Ytv Market News delivers timely market updates, practical trading insights, and clear explanations of macro and company-level catalysts that move prices. Combines on-the-ground financial reporting with technical analysis, using concise charts and actionable ideas to help investors and traders make smarter decisions.
Latest entries
 Investing InsightsAugust 24, 2026Lee Eok-won: “Relocation Loan LTV to Be Based on Cooperative Member Sale Price” — BigGo Finance
 GermanyAugust 24, 2026Germany’s Uniper says it has filled 70% of its contracted gas storage
 Crypto NewsAugust 24, 2026Bitcoin Hits $71,992 As Historic Short Squeeze Shakes Crypto
 Crypto NewsAugust 24, 2026Pi Network holds key support amid Testnet’s upgrade to Protocol 27


