


Following its most recent attempt at recovery, Shiba Inu is under more pressure, and spot-flow data indicates that buyers are finding it difficult to maintain control. After being rejected from its recent local peak, SHIB is trading at about $0.00000532, while seven of the eight short-term flow periods displayed show negative net inflows.
Inflows aren’t impressive
Over a number of time periods, the imbalance is apparent. The net inflow for five minutes is -$11,460, while the readings for fifteen and thirty minutes are roughly -$29,970 and -$89,170, respectively. There is an additional $49,130 deficit during the hour. The pattern is the same farther out.
The net flow for four hours is -$75,850, while the figure for eight hours is -$50,970. With net inflows of about $25,430, only the 12-hour period remains slightly positive. A negative net inflow indicates that, over the course of the measured period, more capital is leaving SHIB spot markets than entering them.
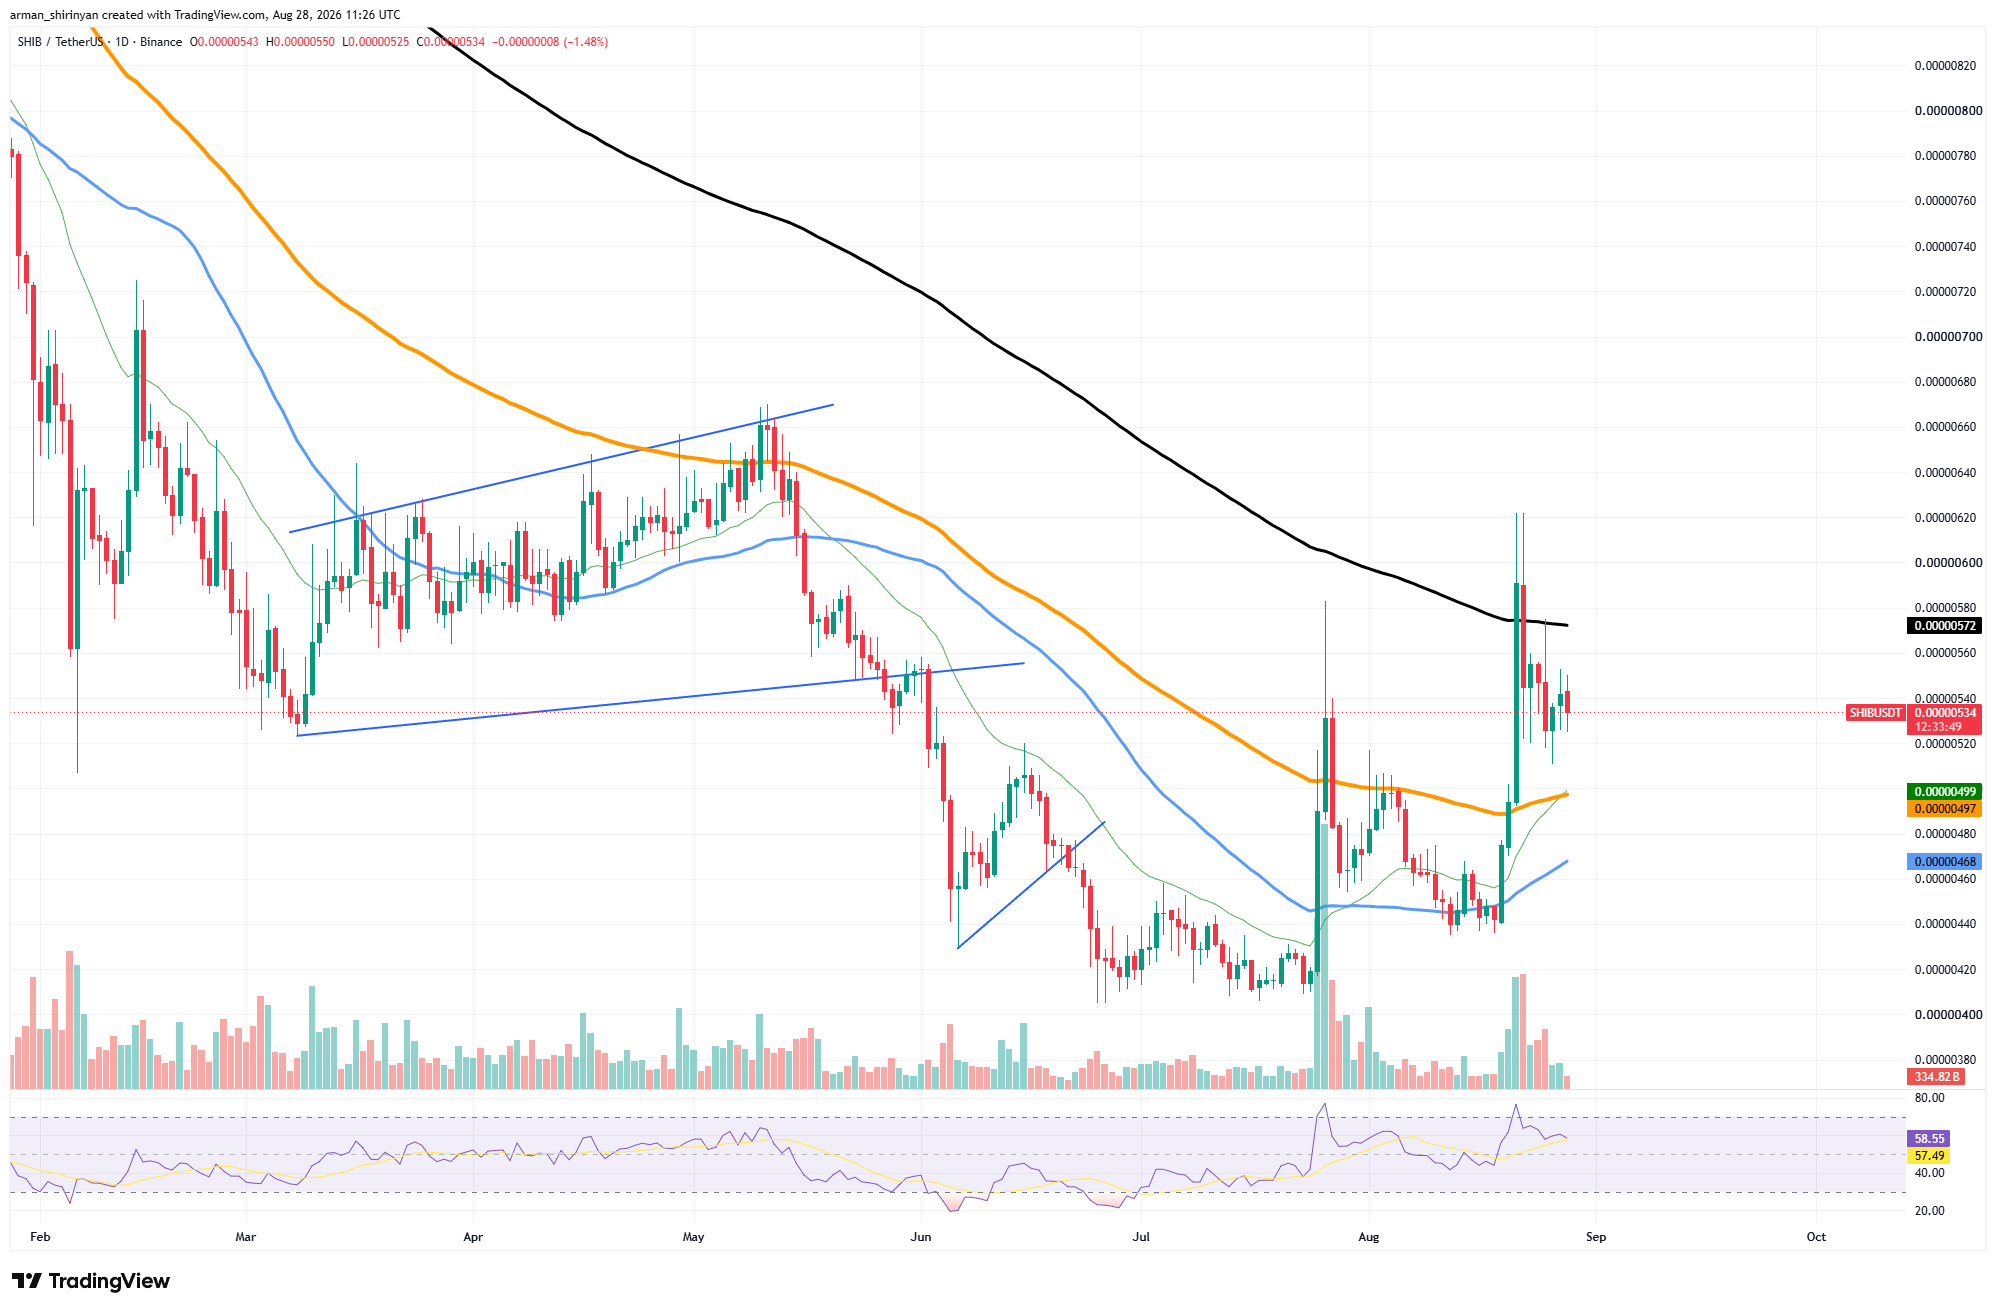
That alone does not ensure that prices will drop. Nonetheless, the consistency across several time periods suggests weak immediate demand in the wake of SHIB’s dramatic increase. The price chart backs up that theory. Recently, SHIB surged from about $0.0000044 and momentarily reached about $0.0000062 before sellers quickly drove it lower.
Shiba Inu’s key barrier
The most obvious technical barrier is the long-term moving average, currently at $0.00000572, which the token was unable to recover. SHIB continues to trade comfortably above its shorter moving averages at about $0.00000532. The first significant cluster is located between $0.00000497 and $0.00000499, while another moving average offers support close to $0.00000468.
You Might Also Like

This indicates that although the recent breakout structure has weakened, it has not yet been totally disproved. Additionally, momentum has returned to normal. After momentarily rising into overbought territory, the RSI is currently around 58, giving SHIB significantly more room to move in either direction.
Recovering $0.0000055 and eventually breaking through $0.0000057–$0.0000058 are the bulls’ immediate goals. The recent $0.0000062 high would then be relevant again. However, the correction may reach $0.0000047 if negative spot flows continue and SHIB loses $0.0000050. Therefore, rather than an instant continuation of the prior rally, the current flow picture favors consolidation or more short-term pressure.
Source link
Author

- Ytv Market News
- Share-market news writer and analyst with deep experience covering equities, commodities, forex, and cryptocurrencies for readers in the USA, UK, Canada, and Australia. Ytv Market News delivers timely market updates, practical trading insights, and clear explanations of macro and company-level catalysts that move prices. Combines on-the-ground financial reporting with technical analysis, using concise charts and actionable ideas to help investors and traders make smarter decisions.
Latest entries
 Crypto NewsAugust 29, 2026How Can Bitcoin Withstand Quantum Computers? A Comparison of Three Lattice-Based Signature Schemes
 Investing InsightsAugust 29, 2026Teleflex (TFX) Stock Trades At A Discount On Cash Flow But A Premium On Sales
 UsaAugust 29, 2026Could This Hot Growth Stock Be the Next MercadoLibre? Why It Looks Like a Screaming Buy
 Crypto NewsAugust 29, 2026NFT sales fall 44.7% to $63.3M as Ethereum leads


