


For the time being, Solana’s attempt to break above $100 has failed; after briefly trading above $102, SOL has retreated to about $97. Although the immediate $100 breakout is invalidated by the rejection, it would be premature to declare the bullish recovery to have ended.
Solana’s key level invalidated
SOL has already increased by about 27% over the last 30 days and 26% over the last seven. The asset overcame a number of significant technical obstacles as a result of the rally, including the long-term moving average, which is currently at $89.50. This is still the move’s most significant accomplishment.
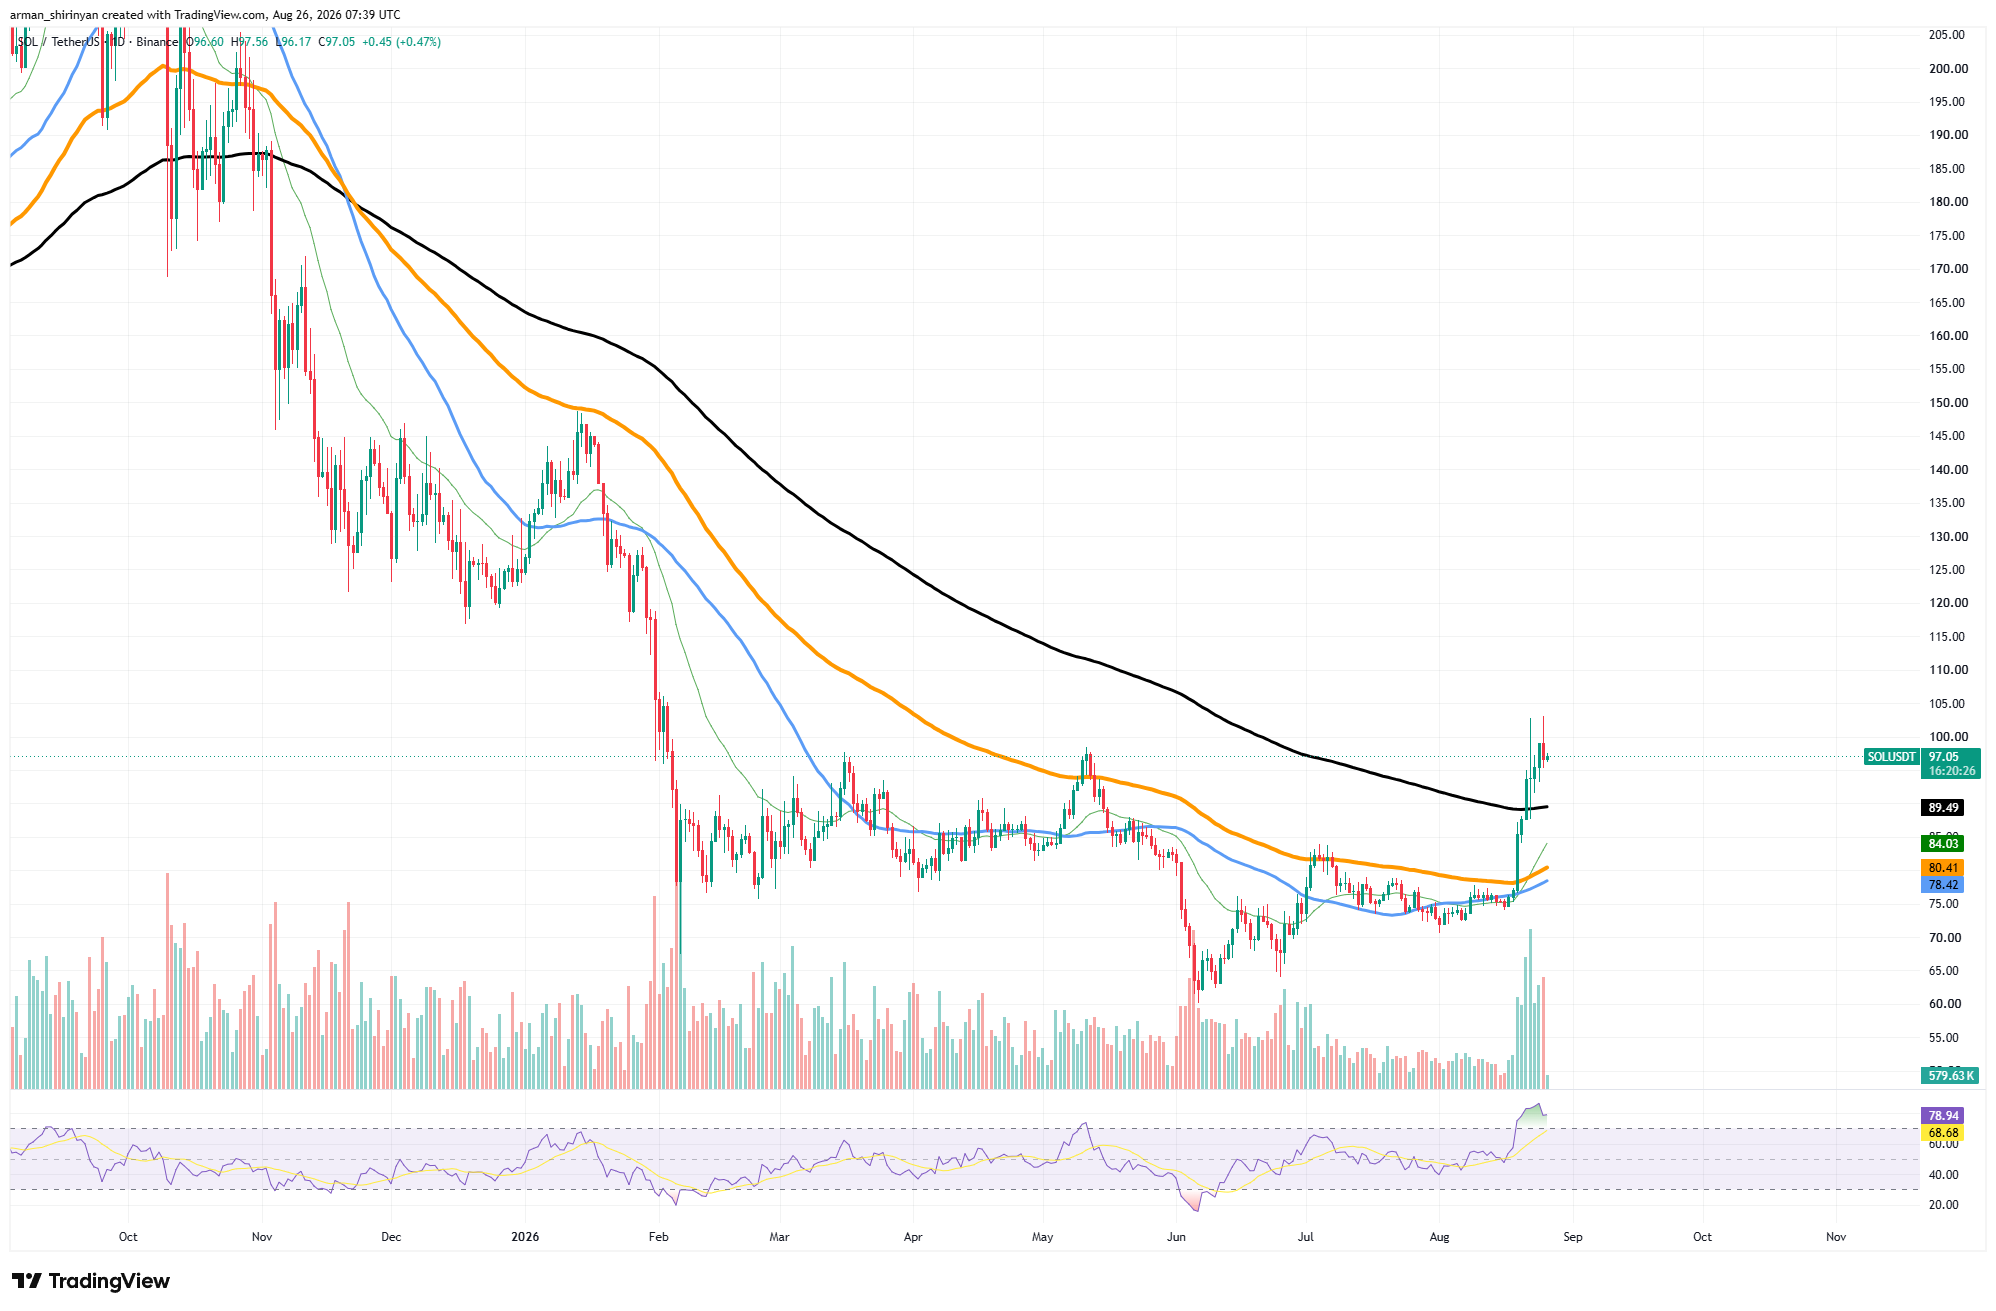
However, the $100 rejection reveals a number of immediate issues. At roughly 79, the RSI is still very high, indicating that momentum has entered overbought territory. Some profit-taking and deleveraging should not be shocking after such a quick expansion from the mid-$70s. The positioning of derivatives also appears aggressive.
While top traders exhibit ratios above 2.0, Binance’s SOL/USDT long/short ratio is roughly 2.07. Because of this positioning, there are significantly more longs than shorts among the measured accounts. The results are already evident in liquidation data. Over the course of a day, about $17.51 million in SOL positions were liquidated.
Futures are dictating the picture
In the meantime, a net outflow of about $60.77 million is seen in 12-hour futures flows. This makes it possible for further leveraged longs to be forced out in the event of another downward move. A bearish reversal has not yet been confirmed by the larger chart, though.

At $89.49, SOL is still comfortably above the long-term moving average, while the shorter averages are grouped around $78 and $84. Additionally, during the breakout, trading volume increased significantly, indicating significant participation in the rally. Therefore, $89–$90, not $100, is the immediate level to monitor.
The rejection may continue to be a typical post-breakout correction if SOL maintains its position above this previous resistance level. Before attempting another move through $100–$103, buyers could consolidate.
The situation would change if the daily close broke below $89. It would expose $84 and bring SOL back below its primary long-term trend indicator, followed by the $78–$80 cluster. As of right now, the $100 target has been rejected rather than completely removed.
SOL must demonstrate that the breakout above $89 was structural rather than just a transient spike in order for the bull case to continue.
Source link
Author

- Ytv Market News
- Share-market news writer and analyst with deep experience covering equities, commodities, forex, and cryptocurrencies for readers in the USA, UK, Canada, and Australia. Ytv Market News delivers timely market updates, practical trading insights, and clear explanations of macro and company-level catalysts that move prices. Combines on-the-ground financial reporting with technical analysis, using concise charts and actionable ideas to help investors and traders make smarter decisions.
Latest entries
 Crypto NewsAugust 27, 2026DeFi Development launches dashboard tracking Solana network data
 Politics News TodayAugust 27, 2026Trump questions state of MLB while renewing push for Roger Clemens’ Hall of Fame induction
 Market Movers TodayAugust 27, 2026Nvidia (NASDAQ:NVDA) Delivers Impressive Q2
 Forex NewsAugust 27, 2026Chinese Yuan: Further gains toward 6.7000 against US Dollar – UOB


