

Vector (NZSE:VCT) is back in focus after reporting full year 2026 earnings on 18 August. The company highlighted a 55% rise in net profit, supported by electricity network performance and higher capital investment.
See our latest analysis for Vector.
Despite the strong full year 2026 result, Vector’s recent share price has been softer, with the stock around NZ$4.90 and the 90 day share price return down 2.58%. Even so, the 1 year total shareholder return of 16.68% and 5 year total shareholder return of 53.52% indicate that long term holders have seen materially stronger outcomes than short term traders. This may reflect shifting expectations around earnings resilience and capital investment.
If Vector’s earnings story has your attention, it can also be useful to see how other power and grid related businesses are priced through the 39 power grid technology and infrastructure stocks
Vector’s shares now sit only slightly below the average analyst price target, despite the recent pullback. Is that small discount a chance to buy into earnings strength, or a sign the market’s caution is warranted?
Most Popular Narrative: 2.3% Undervalued
Vector’s most followed narrative suggests fair value of about NZ$5.02 per share, only slightly above the recent NZ$4.90 close. The gap is small, but the earnings and cash flow assumptions behind it are detailed.
Higher expected long-term electricity demand from Auckland’s ongoing urban growth and accelerating electrification (including EV adoption) is likely to drive steady growth in regulated asset base, supporting sustainable increases in regulated revenues. Regulatory resets (DPP4) have resulted in a step-up in allowed distribution revenues beginning April 2025, and with ongoing customer-driven network connections, this should underpin robust revenue growth and enhanced EBITDA over the next regulatory cycle.
Want to see what underpins that fair value for Vector? The narrative leans on a defined revenue growth path, wider margins, and a future earnings multiple that assumes real discipline on execution.
Result: Fair Value of NZ$5.02 (UNDERVALUED)
Have a read of the narrative in full and understand what’s behind the forecasts.
However, you also need to weigh Vector’s exposure to declining gas demand and ongoing regulatory resets, which could pressure revenues and margins if conditions turn less favourable.
Find out about the key risks to this Vector narrative.
Another View On Vector Using Cash Flows
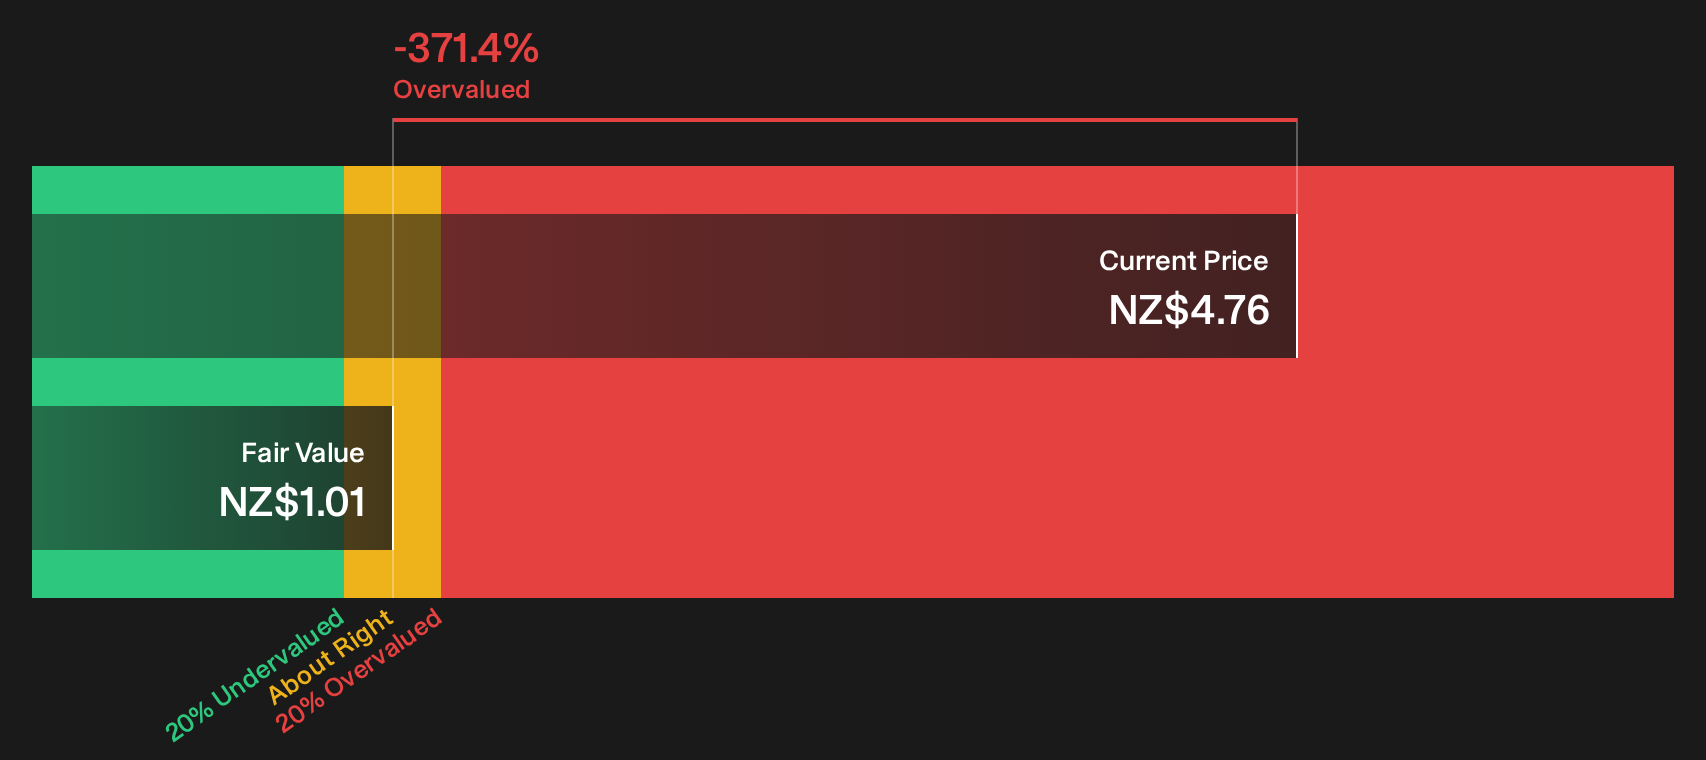
The fair value narrative around Vector leans on earnings and multiples, yet the SWS DCF model tells a very different story. On this view, Vector at NZ$4.90 trades well above an estimated future cash flow value of NZ$1.01, which screens as clearly overvalued rather than modestly undervalued. Which lens do you trust more for a long term position?
For a closer look at how this cash flow based view is built, and the assumptions behind it, take a moment to review the Look into how the SWS DCF model arrives at its fair value.
Simply Wall St performs a discounted cash flow (DCF) on every stock in the world every day (check out Vector for example). We show the entire calculation in full. You can track the result in your watchlist or portfolio and be alerted when this changes, or use our stock screener to discover 272 high quality undervalued stocks. If you save a screener we even alert you when new companies match – so you never miss a potential opportunity.
Next Steps
With mixed signals around Vector, this is the moment to check the numbers yourself and move quickly to shape an informed view. Start by weighing both sides of the story through the 2 key rewards and 2 important warning signs.
Looking for more investment ideas beyond Vector?
Do not stop with Vector. You owe it to yourself to scan the market for other opportunities that match your goals and risk comfort.
This article by Simply Wall St is general in nature. We provide commentary based on historical data
and analyst forecasts only using an unbiased methodology and our articles are not intended to be financial advice. It does not constitute a recommendation to buy or sell any stock, and does not take account of your objectives, or your
financial situation. We aim to bring you long-term focused analysis driven by fundamental data.
Note that our analysis may not factor in the latest price-sensitive company announcements or qualitative material.
Simply Wall St has no position in any stocks mentioned.
New: Manage All Your Stock Portfolios in One Place
We’ve created the ultimate portfolio companion for stock investors, and it’s free.
• Connect an unlimited number of Portfolios and see your total in one currency
• Be alerted to new Warning Signs or Risks via email or mobile
• Track the Fair Value of your stocks
Have feedback on this article? Concerned about the content? Get in touch with us directly. Alternatively, email editorial-team@simplywallst.com
Source link


