


Gold (XAU/USD) price retreats some 0.40% on Monday after last Friday’s hawkish remarks by Federal Reserve (Fed) Chair Kevin Warsh, which sparked speculation of a possible rate hike at the September meeting. Despite this, bullion is poised to end the month with gains of over 9%, with XAU/USD trading at $4,432 after hitting a daily high of $4,472.
XAU/USD retreats as higher Oil prices revive inflation and Fed hike risks
Warsh’s said last Friday that the Fed is committed to tackling high inflation, even if it does not aim for the 2% goal, with the new Fed Chair noting that they “have work to do” if prices remain elevated.
Aside from this, the main theme on Monday is the conflict in the Middle East. The US and Iran exchanged strikes, which pushed energy prices higher. West Texas Intermediate (WTI), the US crude Oil benchmark, rose 2.50% on Monday to $85.62, a headwind for the yellow metal.
Why? Becausehigher energy prices increase the chances of higher interest rates. Hence, Gold fares positively amid lower-yield environments, not the current one, as the US 10-year Treasury yield is up two and a half basis points at 4.706%.
The Greenback retreats some 0.25%, according to the US Dollar Index (DXY). The DXY, which tracks the performance of the buck against six currencies, is at 99.42, below last week’s high of 99.72.
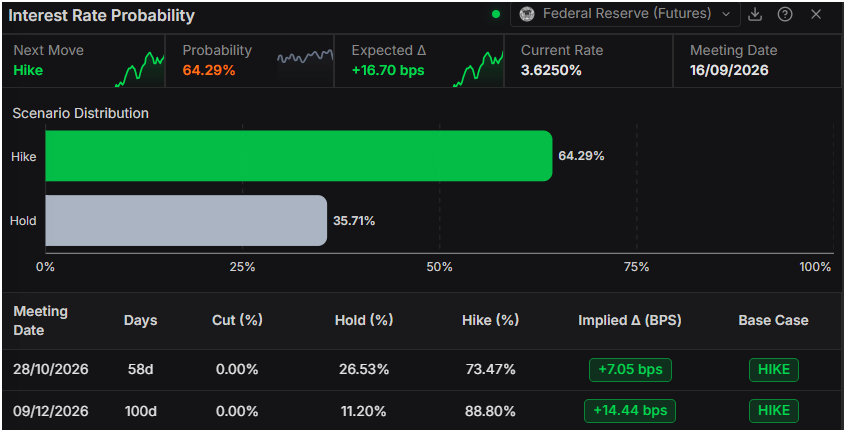
Given the current backdrop, money markets have priced in at least 26 basis points of tightening towards the year-end, according to Prime Terminal. For the September 16 meeting, the odds stand at 64% for a hike and 36% for keeping the Fed funds rate unchanged at 3.50%-3.75%.
Ahead this week, the US economic docket will be busy, with the release of ISM Manufacturing and Services PMIs, a tranche of jobs data – JOLTS Job Openings and Initial Jobless Claims –and, to end, Nonfarm Payrolls figures.
XAU/USD technical analysis: Gold fails to conquer $4,500, eyes are on 100-day SMA
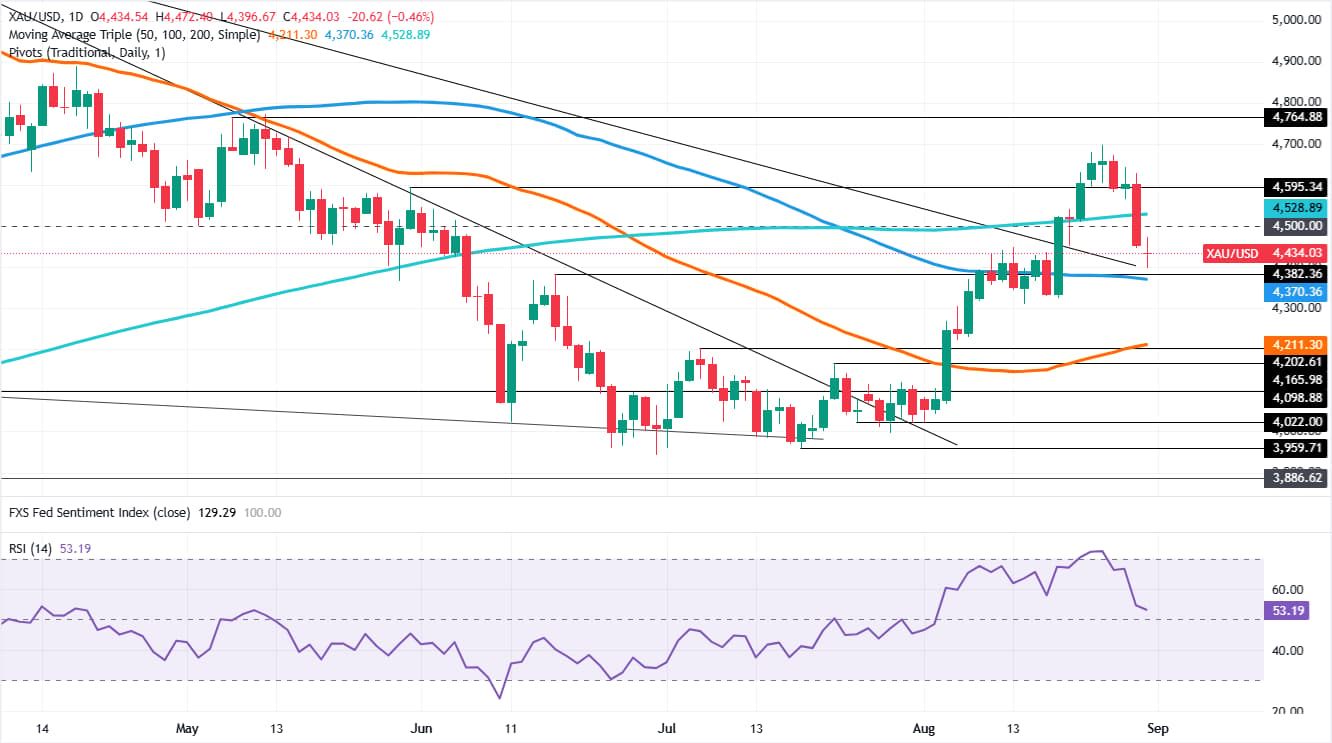
Price action shows Gold is trapped within the 100- and 200-day Simple Moving Averages (SMAs) at around $4,370 and $4,528, respectively, with no definitive direction as a ‘doji’ candle forms in the daily chart.
The Relative Strength Index (RSI) seems to be normalising, despite remaining above its 50-neutral level, which suggests buyers are in charge, but price action suggests XAU could be trading sideways.
For a bullish resumption, Gold must reclaim $4,500 followed by the 200-day SMA. Above this area, the next resistance is the August 25 swing high at $4,697, ahead of the $4,700 mark
Downwards, the first support is $4,400, followed by the 100-day SMA. A decisive push below that level opens the path to $4,300 and to the 50-day SMA at $4,211.
Gold FAQs
Gold has played a key role in human’s history as it has been widely used as a store of value and medium of exchange. Currently, apart from its shine and usage for jewelry, the precious metal is widely seen as a safe-haven asset, meaning that it is considered a good investment during turbulent times. Gold is also widely seen as a hedge against inflation and against depreciating currencies as it doesn’t rely on any specific issuer or government.
Central banks are the biggest Gold holders. In their aim to support their currencies in turbulent times, central banks tend to diversify their reserves and buy Gold to improve the perceived strength of the economy and the currency. High Gold reserves can be a source of trust for a country’s solvency. Central banks added 1,136 tonnes of Gold worth around $70 billion to their reserves in 2022, according to data from the World Gold Council. This is the highest yearly purchase since records began. Central banks from emerging economies such as China, India and Turkey are quickly increasing their Gold reserves.
Gold has an inverse correlation with the US Dollar and US Treasuries, which are both major reserve and safe-haven assets. When the Dollar depreciates, Gold tends to rise, enabling investors and central banks to diversify their assets in turbulent times. Gold is also inversely correlated with risk assets. A rally in the stock market tends to weaken Gold price, while sell-offs in riskier markets tend to favor the precious metal.
The price can move due to a wide range of factors. Geopolitical instability or fears of a deep recession can quickly make Gold price escalate due to its safe-haven status. As a yield-less asset, Gold tends to rise with lower interest rates, while higher cost of money usually weighs down on the yellow metal. Still, most moves depend on how the US Dollar (USD) behaves as the asset is priced in dollars (XAU/USD). A strong Dollar tends to keep the price of Gold controlled, whereas a weaker Dollar is likely to push Gold prices up.
Source link
Author

- Ytv Market News
- Share-market news writer and analyst with deep experience covering equities, commodities, forex, and cryptocurrencies for readers in the USA, UK, Canada, and Australia. Ytv Market News delivers timely market updates, practical trading insights, and clear explanations of macro and company-level catalysts that move prices. Combines on-the-ground financial reporting with technical analysis, using concise charts and actionable ideas to help investors and traders make smarter decisions.
Latest entries
 Company NewsAugust 31, 2026Die CNHI-Aktie steigt nach Baird-Upgrades und stärkerem Quartalsergebnis …
 AustraliaAugust 31, 2026Up 75%! Why this rocketing ASX All Ords stock is forecast to deliver more outsized gains
 UsaAugust 31, 2026Tim Cook’s last day as Apple CEO: How he led the tech giant’s rise to $4T
 Politics News TodayAugust 31, 2026Texas learns the hard way not to mock Florida high school football, Lindsey Vonn stuns & USC’s poor showing!

