


XRP price traded near $1.36 on Aug. 31 after falling roughly 7% over seven days, as fading momentum and leveraged position unwinding offset record weekly demand from U.S. spot exchange-traded funds.
Summary
- XRP price retreated from $1.48 to $1.36 but remained above its 4-hour Supertrend support at $1.341.
- U.S. spot XRP ETFs attracted $110.49 million during their strongest inflow week of 2026.
- CoinGlass data shows major liquidation concentrations near $1.35, $1.38, and between $1.44 and $1.50.
- A break below $1.34 could expose $1.28, while reclaiming $1.40 would improve the recovery setup.
XRP price pulls back 7% after August rally
According to data from crypto.news, XRP (XRP) price was trading around $1.36 on Aug. 31 at the time of writing. The token had declined from approximately $1.48 over the previous seven days, leaving it down about 7% for the period.
The pullback followed a rapid recovery from an August low near $0.98. XRP gained more than 30% during the month and briefly reached $1.70 on Aug. 22 before sellers rejected the move. Price then formed a series of lower highs below $1.55, $1.50, and $1.45.
XRP’s 4-hour chart shows that the latest decline brought the token back toward a support area that formed during the initial breakout. The Supertrend indicator remained bullish at $1.341, placing its active support slightly below the market price.
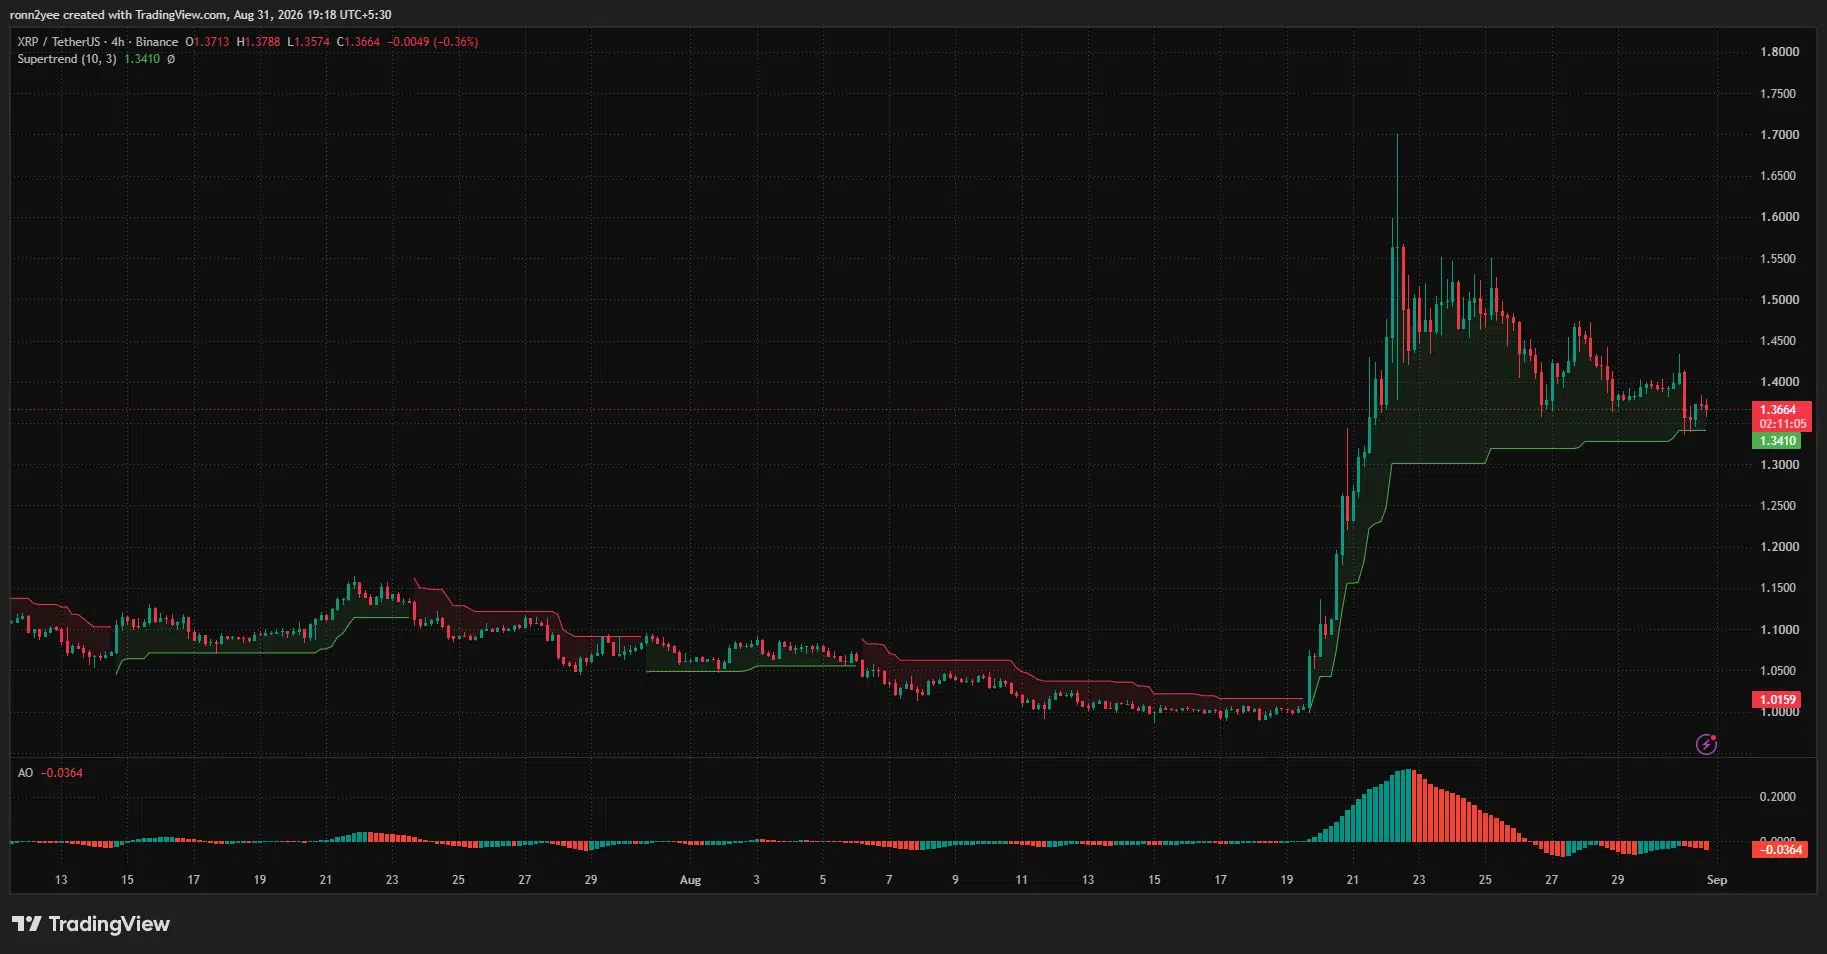
However, the Awesome Oscillator registered a negative reading of -0.0364. Its histogram also stayed below zero, indicating that short-term bearish momentum had not fully cleared despite XRP’s attempt to stabilize above $1.35.
The combination leaves XRP at a decision point. Holding $1.34–$1.35 would preserve the higher trading range created by the August rally, while a confirmed 4-hour close below it could weaken the remaining bullish structure.
ETF inflows counter XRP derivatives reset
U.S. spot XRP ETFs recorded $110.49 million in net inflows during the week ending Aug. 28, according to data from SoSoValue. It was their strongest weekly result of 2026.
The funds held about $1.44 billion in net assets after the inflows, while cumulative net inflows reached approximately $1.66 billion. The demand created a contrast between institutional fund flows and XRP’s falling market price.
Derivatives traders took a more defensive position. Aggregate XRP futures open interest had climbed to approximately $2.73 billion earlier in August, its highest level since October, as leveraged traders positioned for a larger move.
Price and open interest later declined together as XRP retreated from the $1.48–$1.50 resistance zone. Such a combination generally points to traders closing existing positions rather than building an aggressive new short position, although open-interest changes alone cannot identify every trader’s direction.
The reset reduced some of the leverage accumulated during the rally. It did not, however, produce enough spot buying to return XRP above $1.40 before the end of the month.
XRP liquidation map identifies the next price magnets
The one-week CoinGlass liquidation heatmap places the largest nearby liquidity concentrations around $1.35 and $1.38. XRP tested both areas during the Aug. 31 decline and was trading between them when the chart was captured.
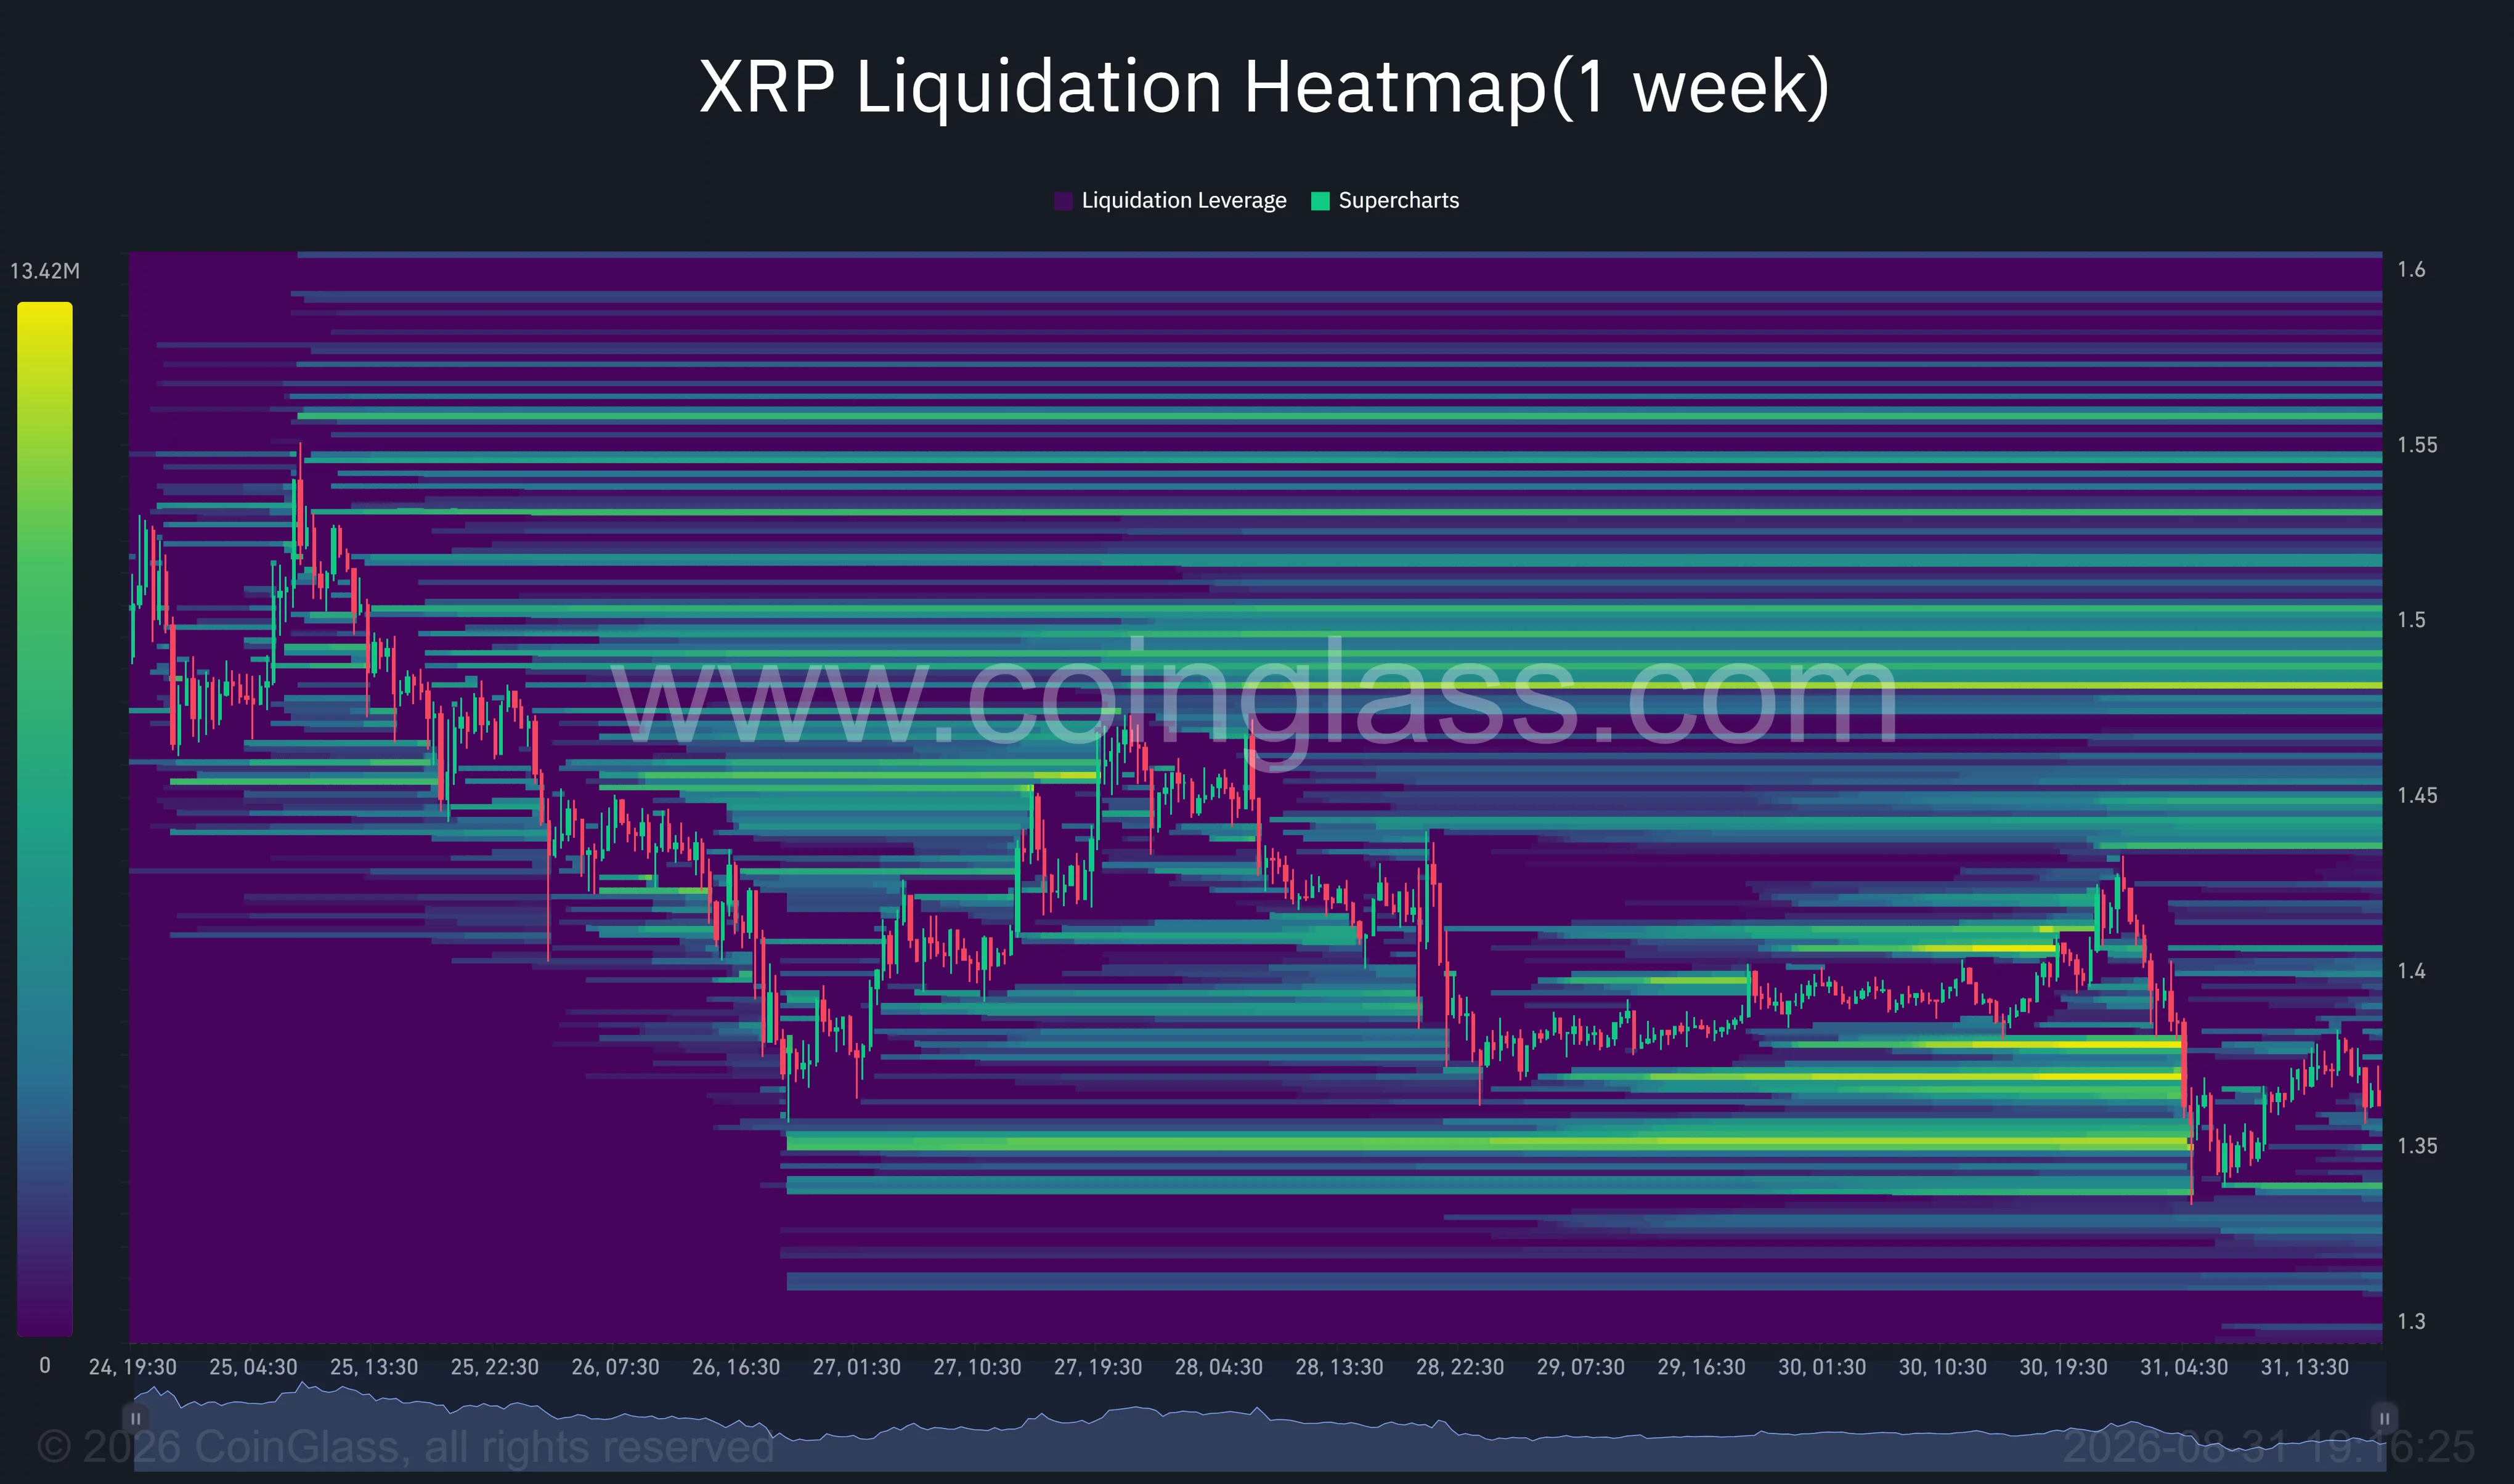
A concentrated band around $1.35 could attract further price movement if sellers retest the weekly low. Losing that level would place the next visible liquidity pockets near $1.33 and $1.30.
Liquidity also remains stacked above the market. The first meaningful overhead cluster appears near $1.40–$1.42, followed by a broader concentration between $1.44 and $1.45. Larger liquidation bands extend toward $1.48–$1.50.
Those zones could accelerate a rebound if XRP moves higher and forces leveraged short positions to close. They can also act as resistance because traders may use the same levels to exit positions.
The daily chart provides a more constructive signal. Chaikin Money Flow stood at 0.09, keeping the indicator above zero and pointing to net buying pressure over its 20-day measurement period. The positive reading suggests capital has not fully left the market despite the weekly price decline.
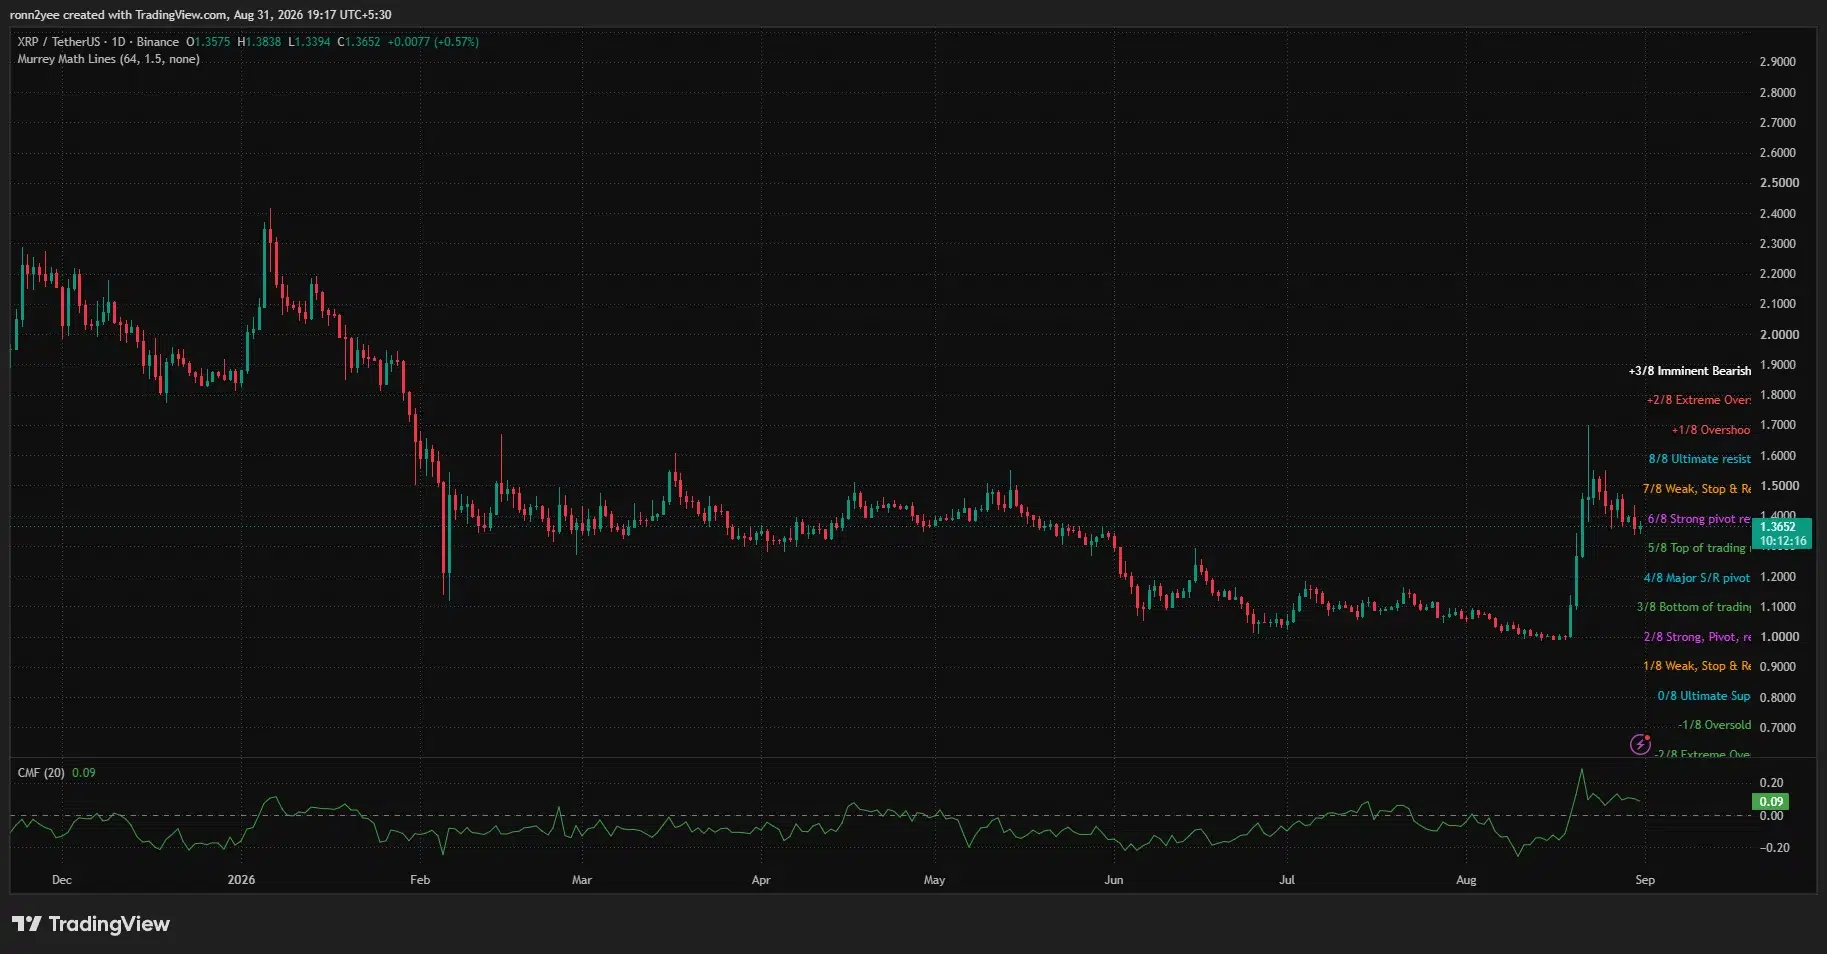
XRP nevertheless remained close to the daily Murrey Math pivot near $1.40. A daily recovery above that level would open a path toward $1.50 and the chart’s $1.60 resistance. Failure to reclaim it would leave the token exposed to another test of the lower trading range.
XRP support at $1.28 becomes the main downside test
Chart analyst ChartNerd said XRP had failed to reclaim its 50-week exponential moving average for a second consecutive week. The analyst placed that average near $1.53 and identified the 20-week EMA around $1.27 as the next short-term support floor.
The weekly rejection adds weight to the $1.48–$1.53 resistance range. A break above the zone would invalidate the present series of lower highs and allow buyers to target $1.60, followed by the August wick near $1.70.
On the downside, the 4-hour Supertrend at $1.341 offers the first line of support. A decisive break could send XRP toward $1.30 and the weekly 20 EMA near $1.27–$1.28. The bullish August recovery would become more vulnerable if the price closes below that moving average.
Ripple’s scheduled escrow release adds another short-term consideration. The company’s monthly system is set to unlock 1 billion XRP on Sept. 1, although Ripple has historically returned a large share of the released tokens to escrow. The scheduled release does not mean the full amount will enter the open market at once.
CLARITY Act vote adds a US policy catalyst
The U.S. Senate is expected to hold a procedural vote on the CLARITY Act on Sept. 15. The vote would test whether supporters can secure the 60 votes required to advance the market-structure legislation.
The vote is not final passage, and no signed law is scheduled for Sept. 15. Its outcome could still affect sentiment toward U.S.-traded digital assets because the proposal seeks to clarify federal oversight of crypto markets.
For XRP, the immediate technical range remains more important. Buyers must protect $1.34–$1.35 and reclaim $1.40 to shift short-term momentum. Losing the lower boundary would increase the risk of a deeper correction toward $1.28, while a move above $1.50 would put the August recovery back in control.
Disclosure: This article does not represent investment advice. The content and materials featured on this page are for educational purposes only.
Source link
Author

- Ytv Market News
- Share-market news writer and analyst with deep experience covering equities, commodities, forex, and cryptocurrencies for readers in the USA, UK, Canada, and Australia. Ytv Market News delivers timely market updates, practical trading insights, and clear explanations of macro and company-level catalysts that move prices. Combines on-the-ground financial reporting with technical analysis, using concise charts and actionable ideas to help investors and traders make smarter decisions.
Latest entries
 Politics News TodayAugust 31, 2026ANALYSIS | The Canadian suspected of spying on NATO was denied bail. Here’s what comes next | CBC News
 UsaAugust 31, 2026Why Tesla Stock Stepped on the Gas Monday Morning
 Crypto NewsAugust 31, 2026Strive buys $143M in Bitcoin, becomes fifth-largest holder
 Politics News TodayAugust 31, 2026Fake Chrome update scam could infect your computer

