


Ethereum price today: $2,480
- ETH Net Taker Volume has flipped positive, but open interest remains weak.
- Ethereum exchange reserves fell by 101K ETH last week.
- ETH has cooled above the $2,431 key level.
After Ethereum (ETH) gained over 30% last week, bulls have begun dominating its net taker volume. The 30-day moving average of the metric flipped positive last week, indicating immediate market activity in perpetual futures leans toward the upside.
Net Taker Volume measures the difference between buying and selling volume of trades executed using market orders in perpetual futures.
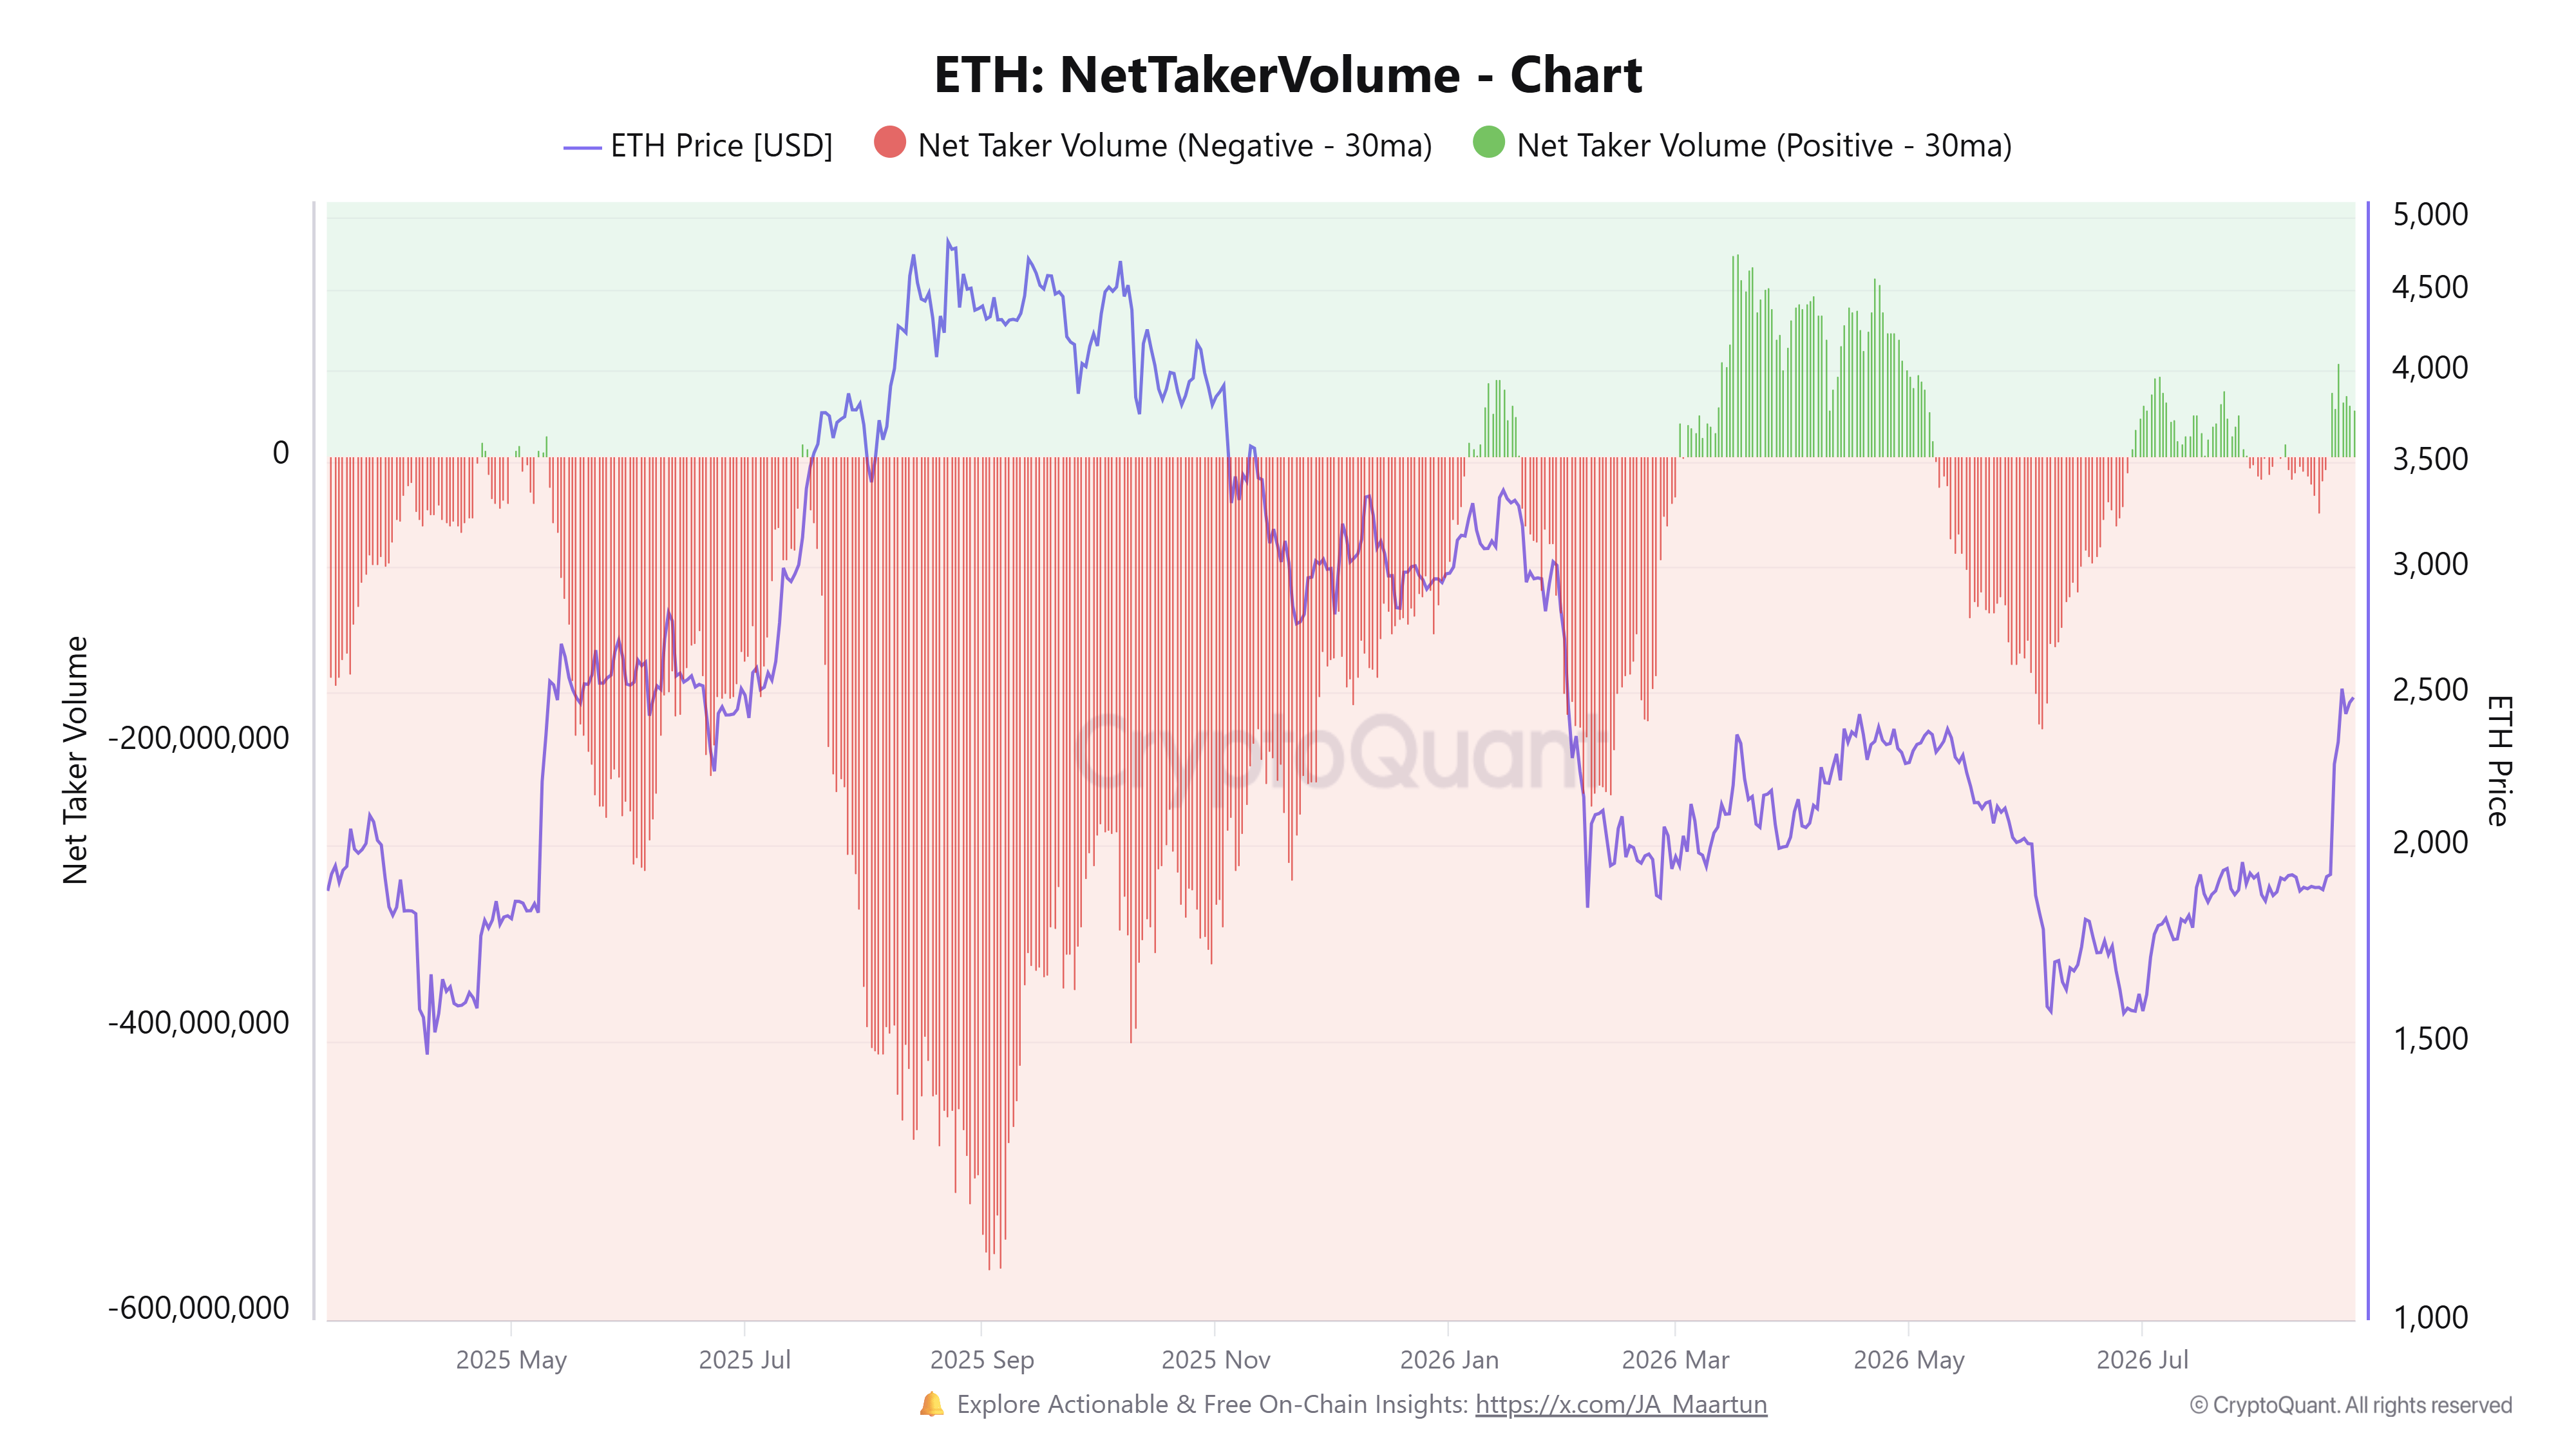
Despite the positive move, new money flowing into ETH futures to defend the rally has been weak. Most of last week’s spike came from an intense short squeeze, with ETH recording its largest short liquidations in history. As shorts covered their positions, the price ripped higher.
With a large number of leveraged bearish bets removed from the market, open interest declined, dropping by roughly 500K ETH over the past week.
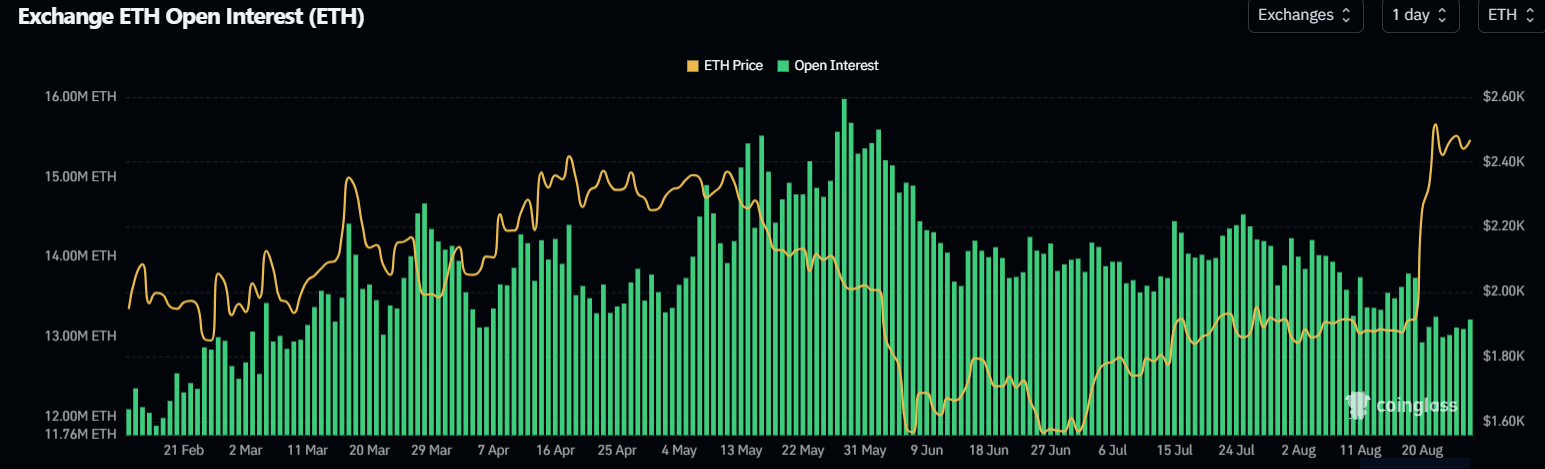
As a result, the Estimated Leverage Ratio (ELR) dropped to 0.74, its lowest level since early March.
The ELR measures the ratio of a digital asset’s exchange reserves against its open interest, with declining values indicating deleveraging.
While fresh derivatives capital hasn’t been strong, spot demand has defended the rally against profit-taking supply. As prices rise, especially above the average on-chain cost basis of $2,300, selling potential increases as investors consider booking profits.
However, Ethereum Exchange Reserves declined by roughly 101K ETH over the past week despite a jump in unrealized profits, indicating net buying pressure.
Ethereum technical outlook: ETH cools above $2,431
On the daily chart, ETH is extending its advance well above the short- and medium-term Exponential Moving Averages, which keeps the near-term bias bullish but stretched. The 20-day EMA at $2,221, the 50-day EMA at $2,042 and the 100-day EMA at $2,003 all run well beneath spot prices, hinting at a firmly supported trend, while the 200-day EMA at $2,204 now acts as a reclaimed longer-term base.
However, momentum looks overheated, with the 14-day Relative Strength Index (RSI) hovering in overbought territory near 75 and the Stochastic Oscillator (Stoch) above 90, suggesting that upside may be vulnerable to consolidation or a corrective pullback.
On the downside, immediate support is seen at the recent horizontal level around $2,431, ahead of the 20-day EMA and the clustered horizontal and average supports at $2,172, $2,042 and $2,003. A deeper retreat would expose the former reaction floor at $1,961, followed by more distant structural cushions at $1,809 and $1,701.
On the topside, ETH faces first resistance at $2,736, with subsequent barriers at $2,885 and $3,241, where profit-taking could intensify if overbought momentum persists.
(The technical analysis of this story was written with the help of an AI tool. Know more.)
Source link
Author

- Ytv Market News
- Share-market news writer and analyst with deep experience covering equities, commodities, forex, and cryptocurrencies for readers in the USA, UK, Canada, and Australia. Ytv Market News delivers timely market updates, practical trading insights, and clear explanations of macro and company-level catalysts that move prices. Combines on-the-ground financial reporting with technical analysis, using concise charts and actionable ideas to help investors and traders make smarter decisions.
Latest entries
 UsaAugust 27, 20261 No-Brainer Dividend ETF to Generate Thousands of Dollars in Passive Income
 AustraliaAugust 27, 2026Here are the top 10 ASX 200 shares today
 Crypto NewsAugust 27, 2026Revolut launched EURR as Tether faces its first EU squeeze
 Politics News TodayAugust 27, 2026Joshua Culver accused of forging Supreme Court order in Indiana case


