


Stacks [$STX] has been on the higher side of late, with the asset’s gains crossing well over 127% in the past few weeks alone, a pattern that has continued since the start of the day.
The rally, however, doesn’t appear to be sustainable, with the growing outflow of capital across the perpetual market and conditions on the chart pointing to overheated sentiment that could force the price even lower from its current level.
The flow of capital remains slim
There’s been a growing capital concentration among short traders in the perpetual market, dictating the direction of flow for $STX as likely being bearish.
Data shows that the Funding Rate has plummeted to about -0.1244% at the time of writing, which remains one of its steepest levels yet.
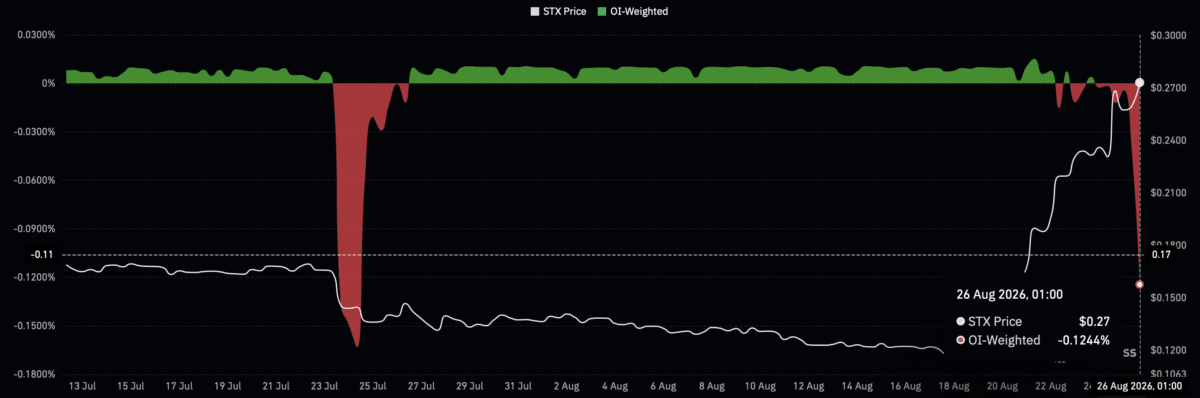
A negative Funding Rate implies that there’s more capital concentration in short positions, with traders anticipating a further decline in price from the current level at which it trades. An aggressive negative rate hints that the downward pull could be strong.
Similarly, sellers have dominated $STX’s perpetual market volume ratio. The Taker Buy/Sell Ratio, which details whether taker buyers or sellers are in control based on readings above or below 1, says the latter is in control.
The Taker Sell Ratio at the time of this analysis has fallen to 0.80, confirming that there has been growing short volume, despite the price yet to catch up.
The market is overpriced
The Bollinger Band analysis of $STX price found that, at the time, investors had overbought it, and the price was trading far above its fair value.
This happens when the price trades into the red line, or upper band, of the BB. At that time, the price was significantly above this zone. What follows is usually a decline, as demand begins to decline.
Likewise, the Relative Strength Index, which tracks the strength of price movements, has shown the same signal, as it crossed into its own overbought zone above 80.
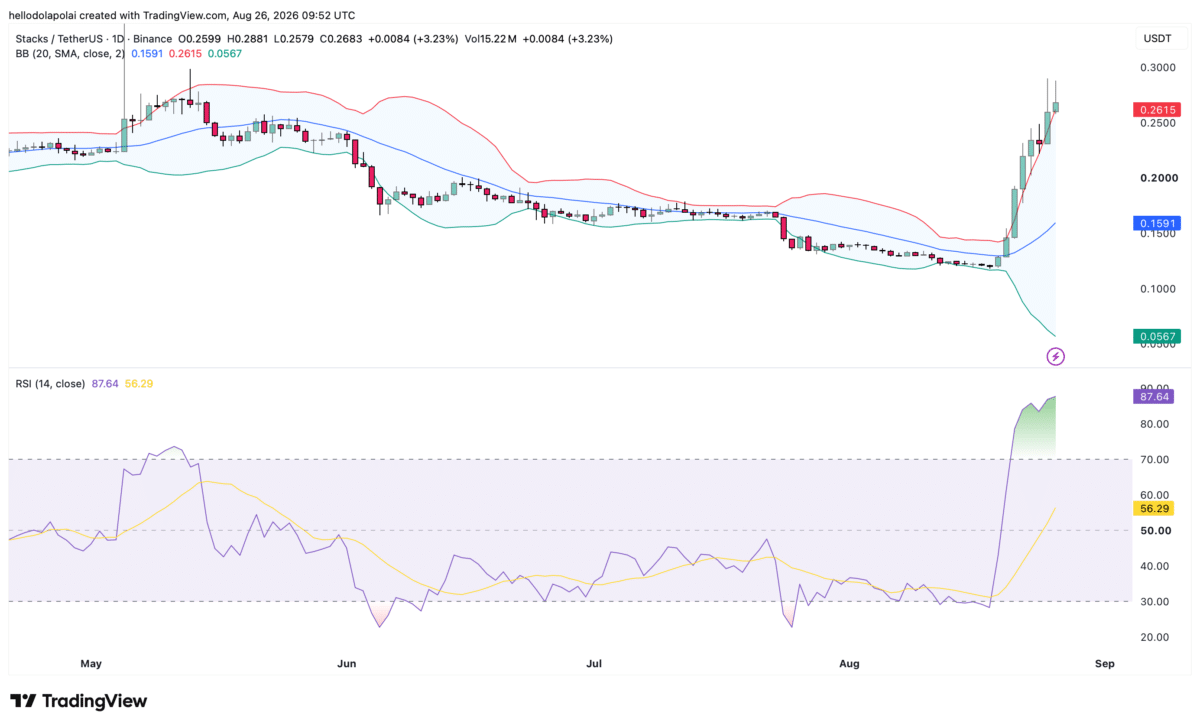
Using the Bollinger Band as a tracker, the present fair value for the price would be the mid-band level, which is the blue line, at the $0.15 price point on the chart. This could act as a support zone, as it historically does.
The upside is capped
Using the one-month liquidation heatmap to analyze $STX and identify cluster zones on the chart, which are areas of unfilled orders above and below the price, shows that there’s limited upside.
Cluster zones appear as shaded areas on the chart. Zones above the price can pull it higher, while zones below can attract it lower.
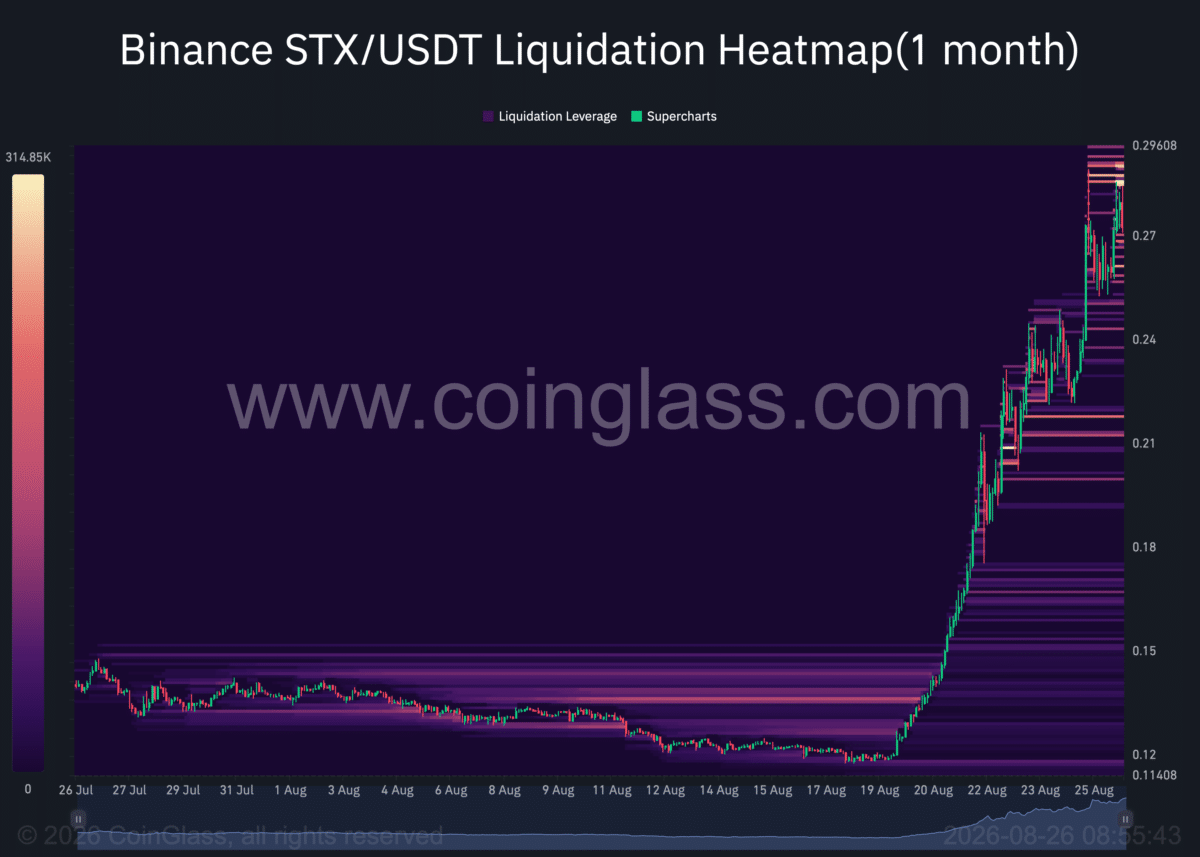
At the moment, the cluster above remains minimal, suggesting that there’s a limit to how far the price could rally from this level. A move into the upward zone would then be followed by a decline in price, as the upward clusters are dominated by sell orders.
Final Summary
- $STX faces growing selling pressure as negative Funding Rates and a low Taker Buy/Sell Ratio point to strong short-side positioning.
- Overbought momentum and limited liquidation clusters above the price suggest $STX could struggle to extend its rally.
Source link
Author

- Ytv Market News
- Share-market news writer and analyst with deep experience covering equities, commodities, forex, and cryptocurrencies for readers in the USA, UK, Canada, and Australia. Ytv Market News delivers timely market updates, practical trading insights, and clear explanations of macro and company-level catalysts that move prices. Combines on-the-ground financial reporting with technical analysis, using concise charts and actionable ideas to help investors and traders make smarter decisions.
Latest entries
 Crypto NewsAugust 27, 2026Revolut Launches First Euro Stablecoin EURR: Here’s Where It’s Available
 Crypto NewsAugust 27, 2026Grayscale: U.S. Treasury Buybacks are ‘Symptomatic Treatment’ as Shift to Cryptocurrency is Expected
 Stock Market VideosAugust 27, 2026Why Gold Could Beat Stocks From Here
 Investing InsightsAugust 27, 2026Bond yields are surging: Here’s why that could spell trouble


