

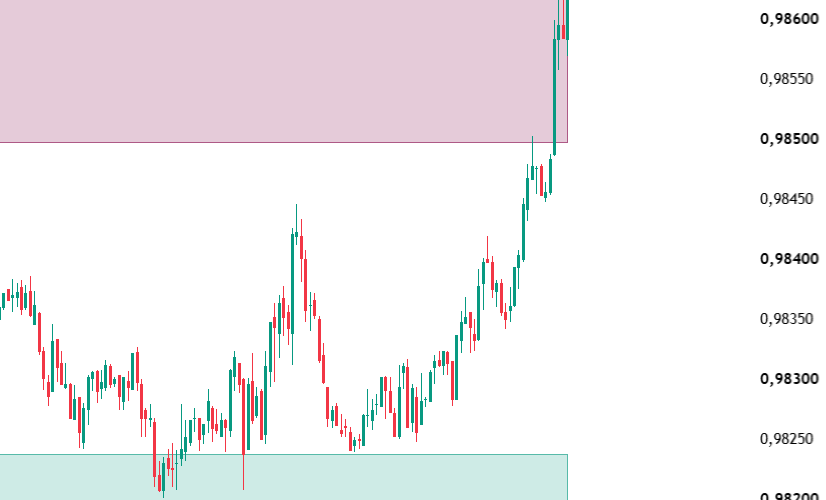
WHAT IT IS
The Trap Indicator is a structure-based tool that automatically detects and marks a specific market sequence known as “the trap”: a Change of Character (CHoCH) that catches one side of the market off guard, followed by a Break of Structure (BOS) that catches the opposite side, before price turns to sweep the liquidity left behind by both groups. Instead of drawing every structure break on the chart, it isolates this particular chained sequence and highlights only the CHoCH, the BOS, and the liquidity pool that sits between them.
WHAT IT IS BASED ON
The indicator is built on core Smart Money Concepts (SMC) / ICT-style ideas: market structure shifts (CHoCH and BOS), and liquidity resting above and below swing points as pools of stop orders that price tends to gravitate toward. The specific sequence it looks for is a practical extension of those building blocks: a structure break in one direction traps traders who enter on it, the market then reverses and breaks structure in the other direction, trapping a second, opposite group, and only after that combined liquidity has been swept does the underlying move tend to unfold with less resistance. The individual concepts (CHoCH, BOS, liquidity) are standard SMC/ICT vocabulary; the way they are chained together here into one tracked pattern is this indicator’s own interpretation of that idea.
WHAT IT IS MADE OF
The indicator works from three consecutive swing points, labeled A, B and C:
– Swing A: a confirmed pivot (high or low) taken as the starting reference.
– Swing B: the swing right after A, in the opposite direction.
– Swing C: the swing right after B, in the same direction as A, but going further than A (a lower low for a bullish resolution, a higher high for a bearish resolution). This is what confirms the CHoCH — structure breaking against the initial A-to-B move, trapping whoever entered on it.
From there:
– BOS line: plotted when price closes back beyond swing B, confirming a Break of Structure in the opposite direction and trapping a second group of traders who act on that break.
– Rebound Zone: a box drawn across the price range between swings A and C — the pool of liquidity left behind by both trapped groups. The box grows bar by bar for a set number of bars after the BOS confirms, then disappears automatically, leaving only the CHoCH and BOS marks on the chart.
Swing detection uses standard pivot highs/lows, with an optional ATR-based minimum-amplitude filter to ignore minor, noise-level swings.
HOW TO USE IT
Add the indicator to any symbol and timeframe. When a valid CHoCH forms, an orange line appears at the level that was broken, labeled “CHoCH.” If price then breaks structure the other way, a second line (green for a bullish resolution, red for a bearish one) appears at that level, labeled “BOS,” together with the Rebound Zone box marking the liquidity range between swings A and C. That box is the area to watch: it represents the combined liquidity from both trapped groups, which price often revisits before the larger move plays out. Once the configured number of bars has passed, the box disappears on its own, while the CHoCH and BOS lines remain as a permanent record of the structure shift.
Settings worth adjusting:
– Pivot lookback/lookahead and the amplitude filter control how sensitive swing detection is — lower values catch more (and smaller) swings, higher values focus on more significant structure.
– Rebound zone duration (bars) sets how long the liquidity box stays visible before it is removed.
– Bullish/bearish resolutions can be toggled independently, and all colors, line width and label size are configurable.
This indicator only marks structure — it does not plot entries, targets, or stop levels, and it does not predict that price will necessarily reverse inside the Rebound Zone. It is meant to help visualize where this specific liquidity-trap sequence is forming, so it can be combined with the trader’s own confirmation (price action, volume, or other tools) before making any decision. It is provided for educational and analytical purposes only and does not constitute financial advice.
Source link
Author

- Ytv Market News
- Share-market news writer and analyst with deep experience covering equities, commodities, forex, and cryptocurrencies for readers in the USA, UK, Canada, and Australia. Ytv Market News delivers timely market updates, practical trading insights, and clear explanations of macro and company-level catalysts that move prices. Combines on-the-ground financial reporting with technical analysis, using concise charts and actionable ideas to help investors and traders make smarter decisions.
Latest entries
 Crypto NewsAugust 26, 2026Bitcoin whales move $40M after decade-long dormancy
 Politics News TodayAugust 26, 2026ICE agent Christian Castro set for release after judge rejects TRO
 Market Movers TodayAugust 26, 2026American Eagle, Dick’s, Gap, Victoria’s Secret, and Urban Outfitters Stocks Trade Up, What You Need To Know
 Forex NewsAugust 26, 2026Japanese Yen: Range-bound against US Dollar as markets price BoJ hike – Scotiabank

