

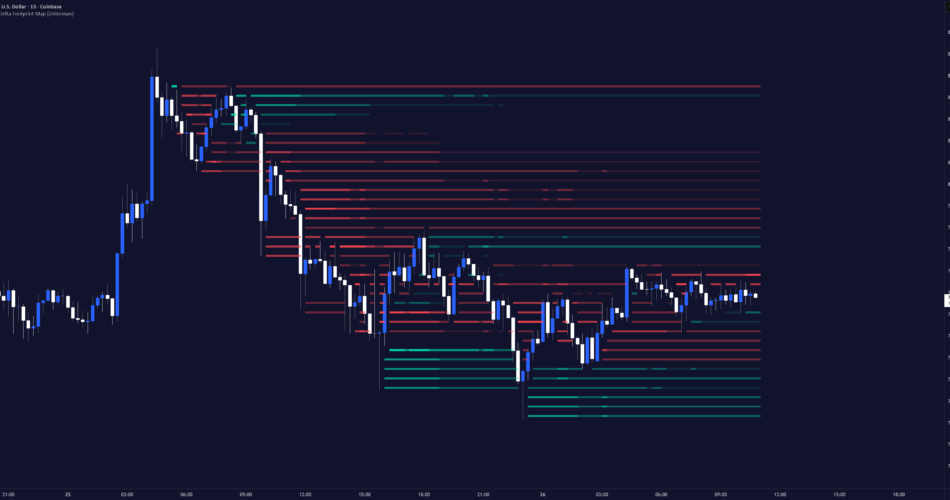
Volume Delta Footprint Map (Zeiierman) is a lower-timeframe volume delta mapping indicator that visualizes where buying and selling pressure develops across both price and time.
The indicator uses lower-timeframe data to estimate the buying and selling activity occurring inside each chart candle. This activity is then mapped across the price levels where it occurred, creating a detailed view of how volume delta develops around price.
The result is a dynamic footprint-style map built directly around price.
Positive Delta stripes highlight areas where estimated buying activity dominated, while Negative Delta stripes highlight areas where estimated selling activity dominated. Stronger concentrations appear with greater visual intensity, allowing important areas of directional participation to stand out immediately.
█ How It Works
⚪ Lower-Timeframe Delta
The indicator analyzes lower-timeframe candles inside each chart candle to estimate directional volume delta.Bullish candles contribute positive volume, while bearish candles contribute negative volume.
⚪ Price Stripe Mapping
The calculation range is divided into horizontal Price Stripes. Each lower-timeframe candle distributes its delta across the price levels it traded through, creating the footprint-style map around price.⚪ Delta Persistence
Delta is carried forward using exponential decay, allowing strong buying or selling pressure to remain visible while older activity gradually fades.⚪ Stripe Strength
Each stripe is ranked by its relative delta magnitude and directional dominance.Stronger concentrations appear more prominently, while weaker activity can be filtered using Minimum Stripe Strength.
⚪ Price Interaction
When enabled, sections of a stripe disappear once price trades through that level, making untouched delta areas easier to identify.
█ How to Use
⚪ Identify Buying Pressure
Strong Positive Delta stripes highlight price areas where lower-timeframe buying activity became dominant.
When several strong positive stripes develop around the same area, it can indicate concentrated bullish participation.
Monitor these areas for continuation, support, absorption, or renewed buying interest if price returns.
⚪ Identify Selling Pressure
Strong Negative Delta stripes highlight areas where lower-timeframe selling activity became dominant.
Clusters of negative delta can reveal areas where sellers became particularly active and may help identify rejection, resistance, bearish continuation, or renewed selling pressure.
⚪ Find Delta Concentrations
The strongest stripes are often more important than isolated weak readings.
A dense area containing several high-intensity stripes shows that directional activity repeatedly concentrated around a similar price region.
These areas can help traders identify where meaningful participation entered the market.
⚪ Find Trapped Buyers and Sellers
• Strong Positive Delta near a high followed by rejection can indicate buyers being absorbed by sellers. If price moves lower, those buyers may be forced to close their positions.
• Strong Negative Delta near a low followed by rejection can indicate sellers being absorbed by buyers. If price moves higher, those sellers may be forced to close their positions.
These areas can become especially important when the Delta concentration forms near key highs, lows, support, resistance, or liquidity zones.
⚪ Find Buyers and Sellers in Control
• Strong Negative Delta near a local swing high followed by continued downside can indicate sellers taking control and pushing price lower.
• Strong Positive Delta near a local swing low followed by continued upside can indicate buyers taking control and pushing price higher.
When price continues to move away from these areas, the Delta concentration can help confirm which side is controlling the move.
█ Settings
- Automatic Lower Timeframe: Automatically selects an appropriate lower timeframe based on the active chart timeframe.
- Manual Lower Timeframe: Selects the lower timeframe used for delta calculations when automatic selection is disabled.
- Lookback Bars: Controls how many historical chart candles are included in the Delta Map.
- Price Stripes: Sets the number of horizontal price levels used to construct the map. More stripes provide greater price resolution.
- Delta Persistence: Controls how long accumulated buying or selling pressure remains active before gradually decaying.
- Minimum Stripe Strength: Filters weaker delta concentrations. Higher values display only stronger directional activity.
- Intensity Steps: Controls how many visual strength levels are used between weak and strong Delta stripes.
- Create Gap When Price Touches Stripe: Removes sections of a stripe where price has already traded through its corresponding price level.
█ Important
Volume Delta Footprint Map estimates directional volume from lower-timeframe candle behavior and available volume data.
It does not require TradingView’s Footprint data and does not represent exchange-level bid and ask transactions.
Instead, it provides a universal footprint-style visualization designed to reveal where directional volume pressure developed, how strong that pressure was, and how its influence evolved across price and time.
—————–
Disclaimer
The content provided in my scripts, indicators, ideas, algorithms, and systems is for educational and informational purposes only. It does not constitute financial advice, investment recommendations, or a solicitation to buy or sell any financial instruments. I will not accept liability for any loss or damage, including without limitation any loss of profit, which may arise directly or indirectly from the use of or reliance on such information.
All investments involve risk, and the past performance of a security, industry, sector, market, financial product, trading strategy, backtest, or individual’s trading does not guarantee future results or returns. Investors are fully responsible for any investment decisions they make. Such decisions should be based solely on an evaluation of their financial circumstances, investment objectives, risk tolerance, and liquidity needs.
Source link
Author

- Ytv Market News
- Share-market news writer and analyst with deep experience covering equities, commodities, forex, and cryptocurrencies for readers in the USA, UK, Canada, and Australia. Ytv Market News delivers timely market updates, practical trading insights, and clear explanations of macro and company-level catalysts that move prices. Combines on-the-ground financial reporting with technical analysis, using concise charts and actionable ideas to help investors and traders make smarter decisions.
Latest entries
 UsaAugust 26, 2026FingerMotion Announces Strategy to Expand into Modular North American AI Compute Infrastructure
 Crypto NewsAugust 26, 2026Martin Shkreli’s newest memecoins are already down 94%
 Investing InsightsAugust 26, 2026Hong Kong Stocks Rebound 174 Points in Morning Session; Tech Shares Regain Footing as Xiaomi Jumps Over 4% — BigGo Finance
 GermanyAugust 26, 2026World stocks gain as oil slips on Hormuz hopes ahead of Nvidia results
