


Dogecoin (DOGE) is approaching the key technical level around $0.094 on Tuesday, which could determine DOGE’s next move. Institutional demand shows mild strength, as spot Exchange Traded Funds (ETFs) recorded positive flows on Monday. Meanwhile, on-chain and derivatives metrics point to caution after the meme coin’s massive 34% rally last week.
Institutional demand shows signs of optimism
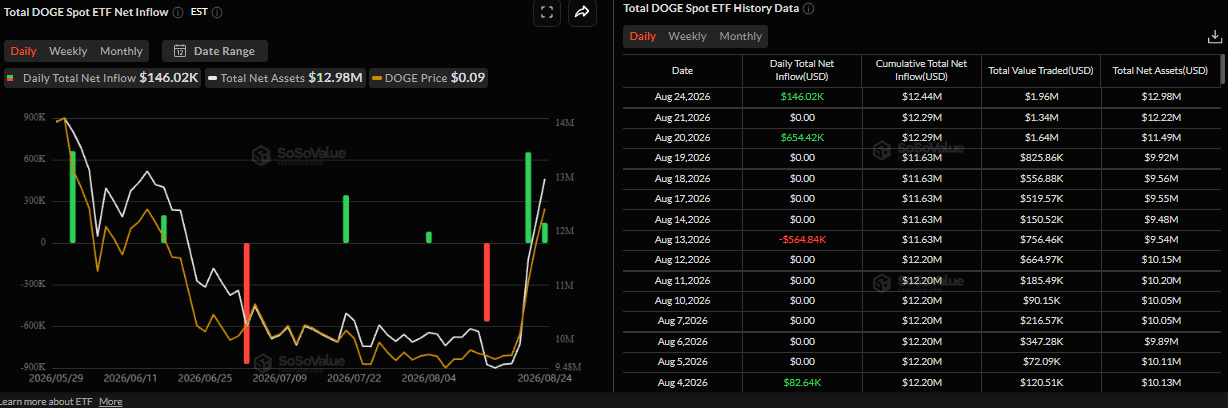
Institutional demand for Dogecoin shows early signs of return. SoSoValue data showed spot Exchange Traded Funds (ETFs) recorded a $146,020 inflow on Monday, following a $653,420 inflow in the previous week, signaling renewed investor interest. If this trend continues and intensifies throughout the week, Dogecoin could extend its rally.
Some signs of concern
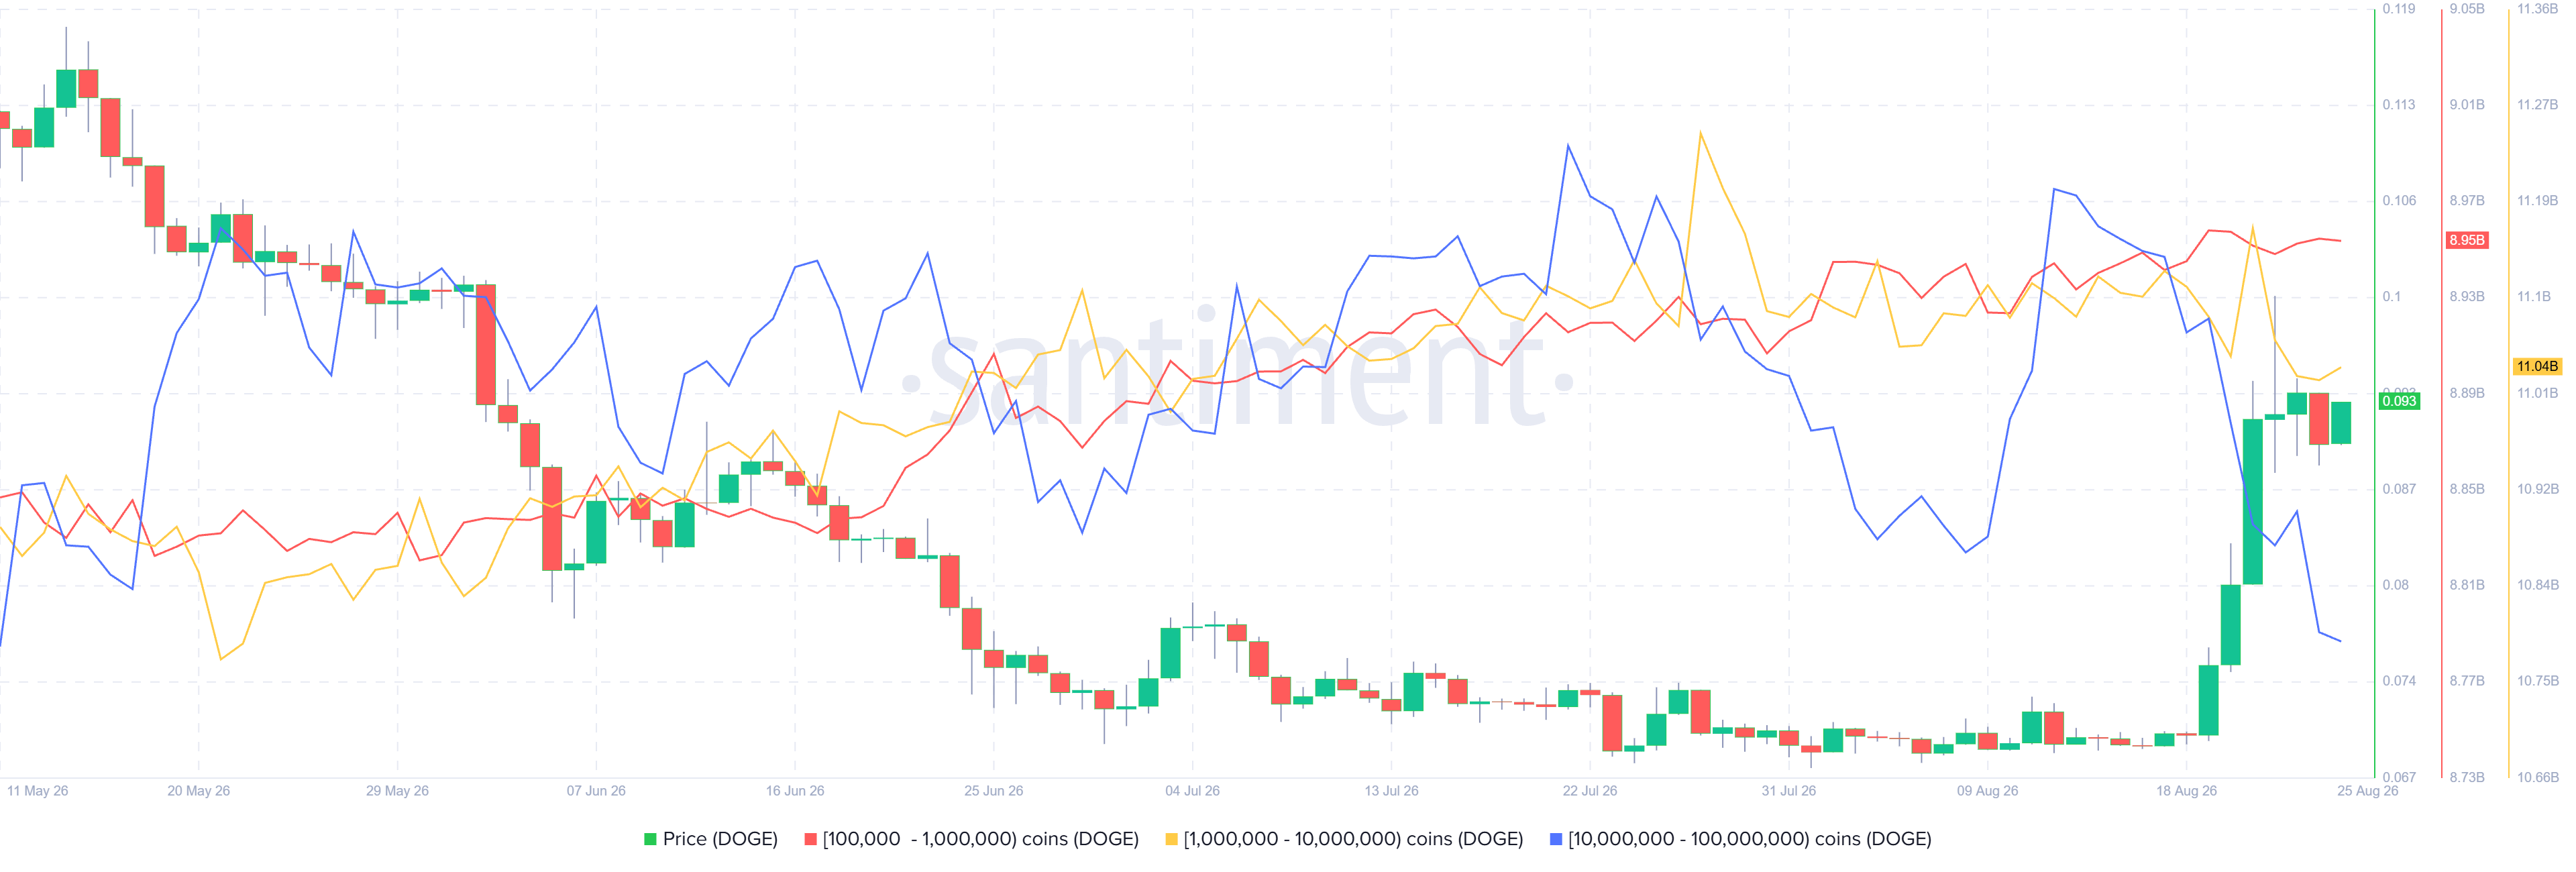
Santiment’s Supply Distribution data shows that large-wallet holders (whales) are steadily offloading tokens, a move that could increase the near-term selling pressure.
The metric indicates that 10 million and 100 million DOGE tokens (blue line) and 1 million and 10 million (yellow line) have collectively reduced their holdings by 280 million DOGE since Friday.
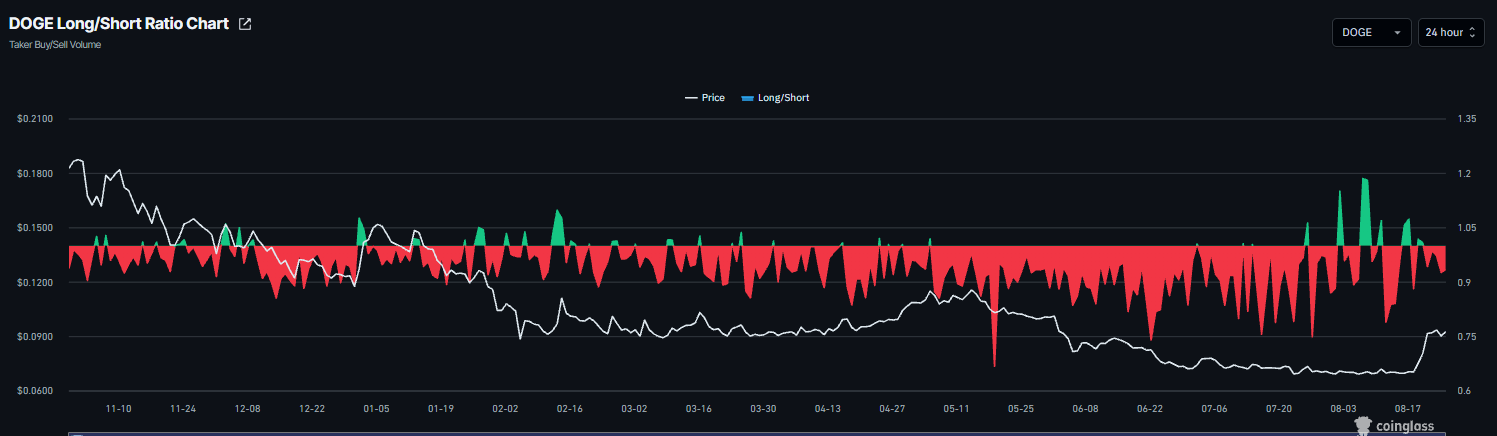
The bearish thesis strengthened as the long-to-short ratio for the meme coin remained below 1, reading 0.93 on Tuesday and nearing the lowest level in over a month. A ratio below one indicates that traders are betting the asset price will fall.
Dogecoin technical outlook: DOGE nears key 200-day EMA
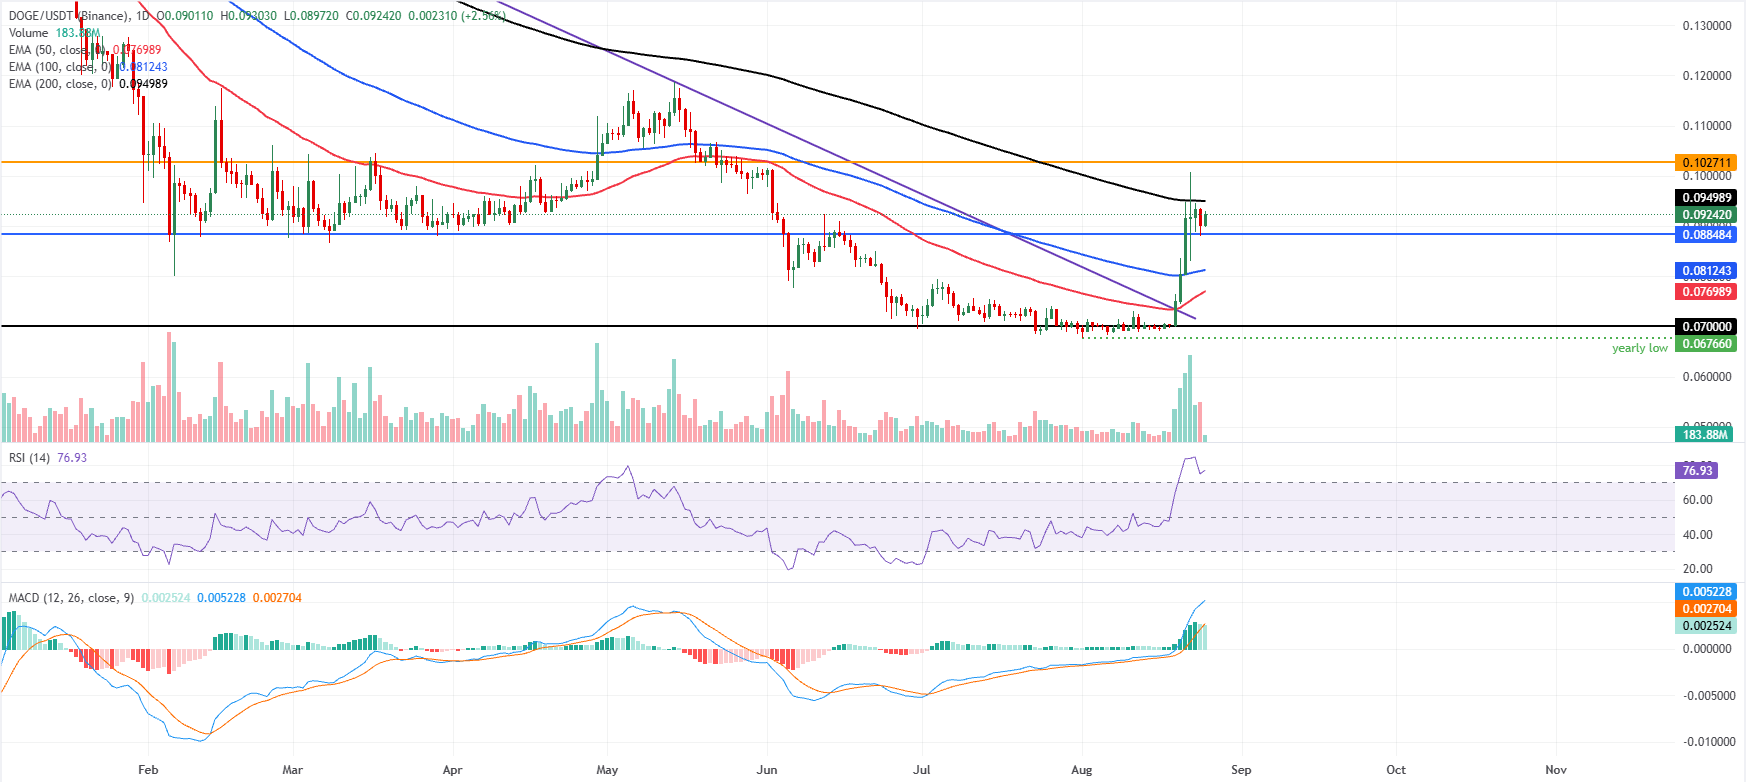
Dogecoin price trades at $0.092 on Tuesday after surging over 34% in the previous week. DOGE is holding a bullish near-term bias as it sits above the 50-day and 100-day Exponential Moving Averages (EMAs) at roughly $0.076 and $0.081, respectively, and well above the reclaimed downtrend resistance line now acting as support near $0.070.
Momentum is stretched, with the Relative Strength Index (RSI) hovering deep in overbought territory near 77 and the Moving Average Convergence Divergence (MACD) histogram positive and elevated, suggesting the rally could face consolidation even as buyers retain control while spot holds above the $0.088 support band.
On the downside, initial protection emerges at the horizontal level around $0.088, ahead of layered dynamic support at the 100-day EMA near $0.081 and the 50-day EMA around $0.076, with the former resistance trendline break near $0.070.
On the topside, immediate resistance is seen at the 200-day EMA around $0.094, with a subsequent barrier at the horizontal cap near $0.102; a daily close above this latter level would strengthen the bullish structure and open the door to further gains, whereas repeated failure below it would hint at a maturing upswing.
(The technical analysis of this story was written with the help of an AI tool. Know more.)
Source link
Author

- Ytv Market News
- Share-market news writer and analyst with deep experience covering equities, commodities, forex, and cryptocurrencies for readers in the USA, UK, Canada, and Australia. Ytv Market News delivers timely market updates, practical trading insights, and clear explanations of macro and company-level catalysts that move prices. Combines on-the-ground financial reporting with technical analysis, using concise charts and actionable ideas to help investors and traders make smarter decisions.
Latest entries
 Crypto NewsAugust 25, 2026Bitcoin Exchange Coinbase Announces Listing of Two Altcoins on Spot Trading Platform! Here Are the Details
 Investing InsightsAugust 25, 2026Mexico GDP Grows 1.4% in Q2 Quarter-on-Quarter; Recovery Underway but Inflation Reacceleration Fuels Rate Hike Expectations — BigGo Finance
 GermanyAugust 25, 2026Shares drift ahead of Nvidia earnings; oil wobbles
 CanadaAugust 25, 2026The money conversation most roommates never have, until it’s too late


