


Ripple (XRP), Cardano (ADA) and Solana (SOL) are trading in the green on Tuesday, sustaining their double-digit gains from last week. The technical outlook for XRP, ADA, and SOL is bullish, with buying pressure mounting.
Ripple extends gains amid firm institutional buying
Ripple is up 2% on Tuesday, extending gains above the $1.50 psychological mark. XRP price maintains an overall bullish trend, sustaining its 50% gain from last week and trading above both the 50-day and 200-day Exponential Moving Averages (EMAs) at $1.1564 and $1.3473, respectively.
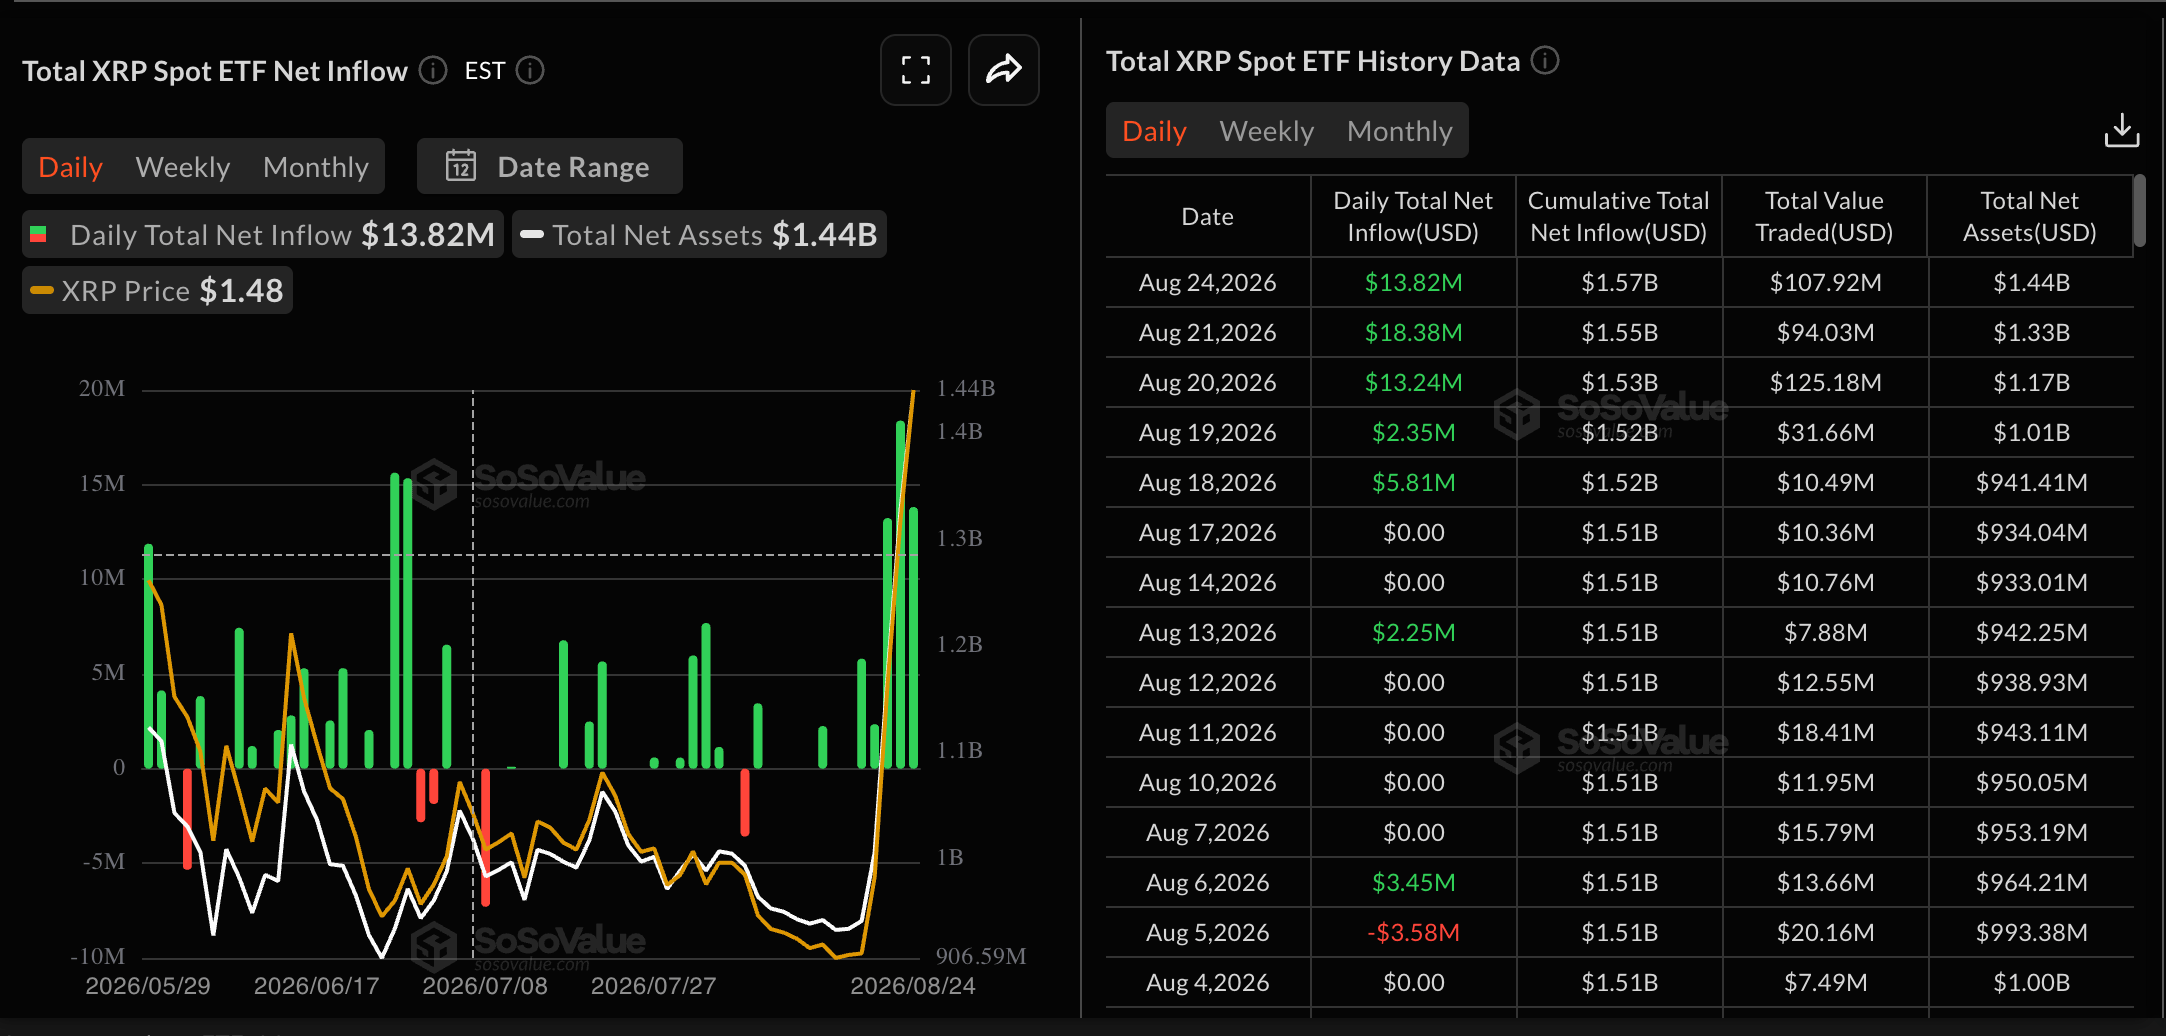
The recent recovery aligns with XRP Exchange-Traded Funds (ETFs) recording $13.82 million in inflows on Monday, suggesting firm institutional demand.
Momentum remains stretched on the daily chart, with the Relative Strength Index (RSI) deep in overbought territory near 82 and the Moving Average Convergence Divergence (MACD) and signal lines holding above zero with positive histogram readings, suggesting strong but potentially overextended upside pressure.
The path of least resistance for XRP targets the November 21 low at $1.8209 as the immediate resistance level.
Looking down, the crucial support for XRP aligns with the 200-day EMA at $1.3473, followed by the $1.2700 demand zone.
Cardano eyes trendline breakout
Cardano is up 2% on Tuesday, holding above the $0.2200 mark. ADA maintains a constructive bullish bias as the price holds well above the 50-day EMA at $0.1889 but remains capped below the 200-day EMA at $0.2486.
From a technical perspective, ADA tests the breakout of an ascending resistance trendline near $0.2328, aligning with the March 29 low. A confirmed breakout above this zone could target the 200-day EMA at $0.2475, followed by the February 2 high at $0.3034.
The RSI hovers in overbought territory around 71, suggesting strong but potentially stretched upside momentum, reinforced by the rising MACD and signal line in positive territory.
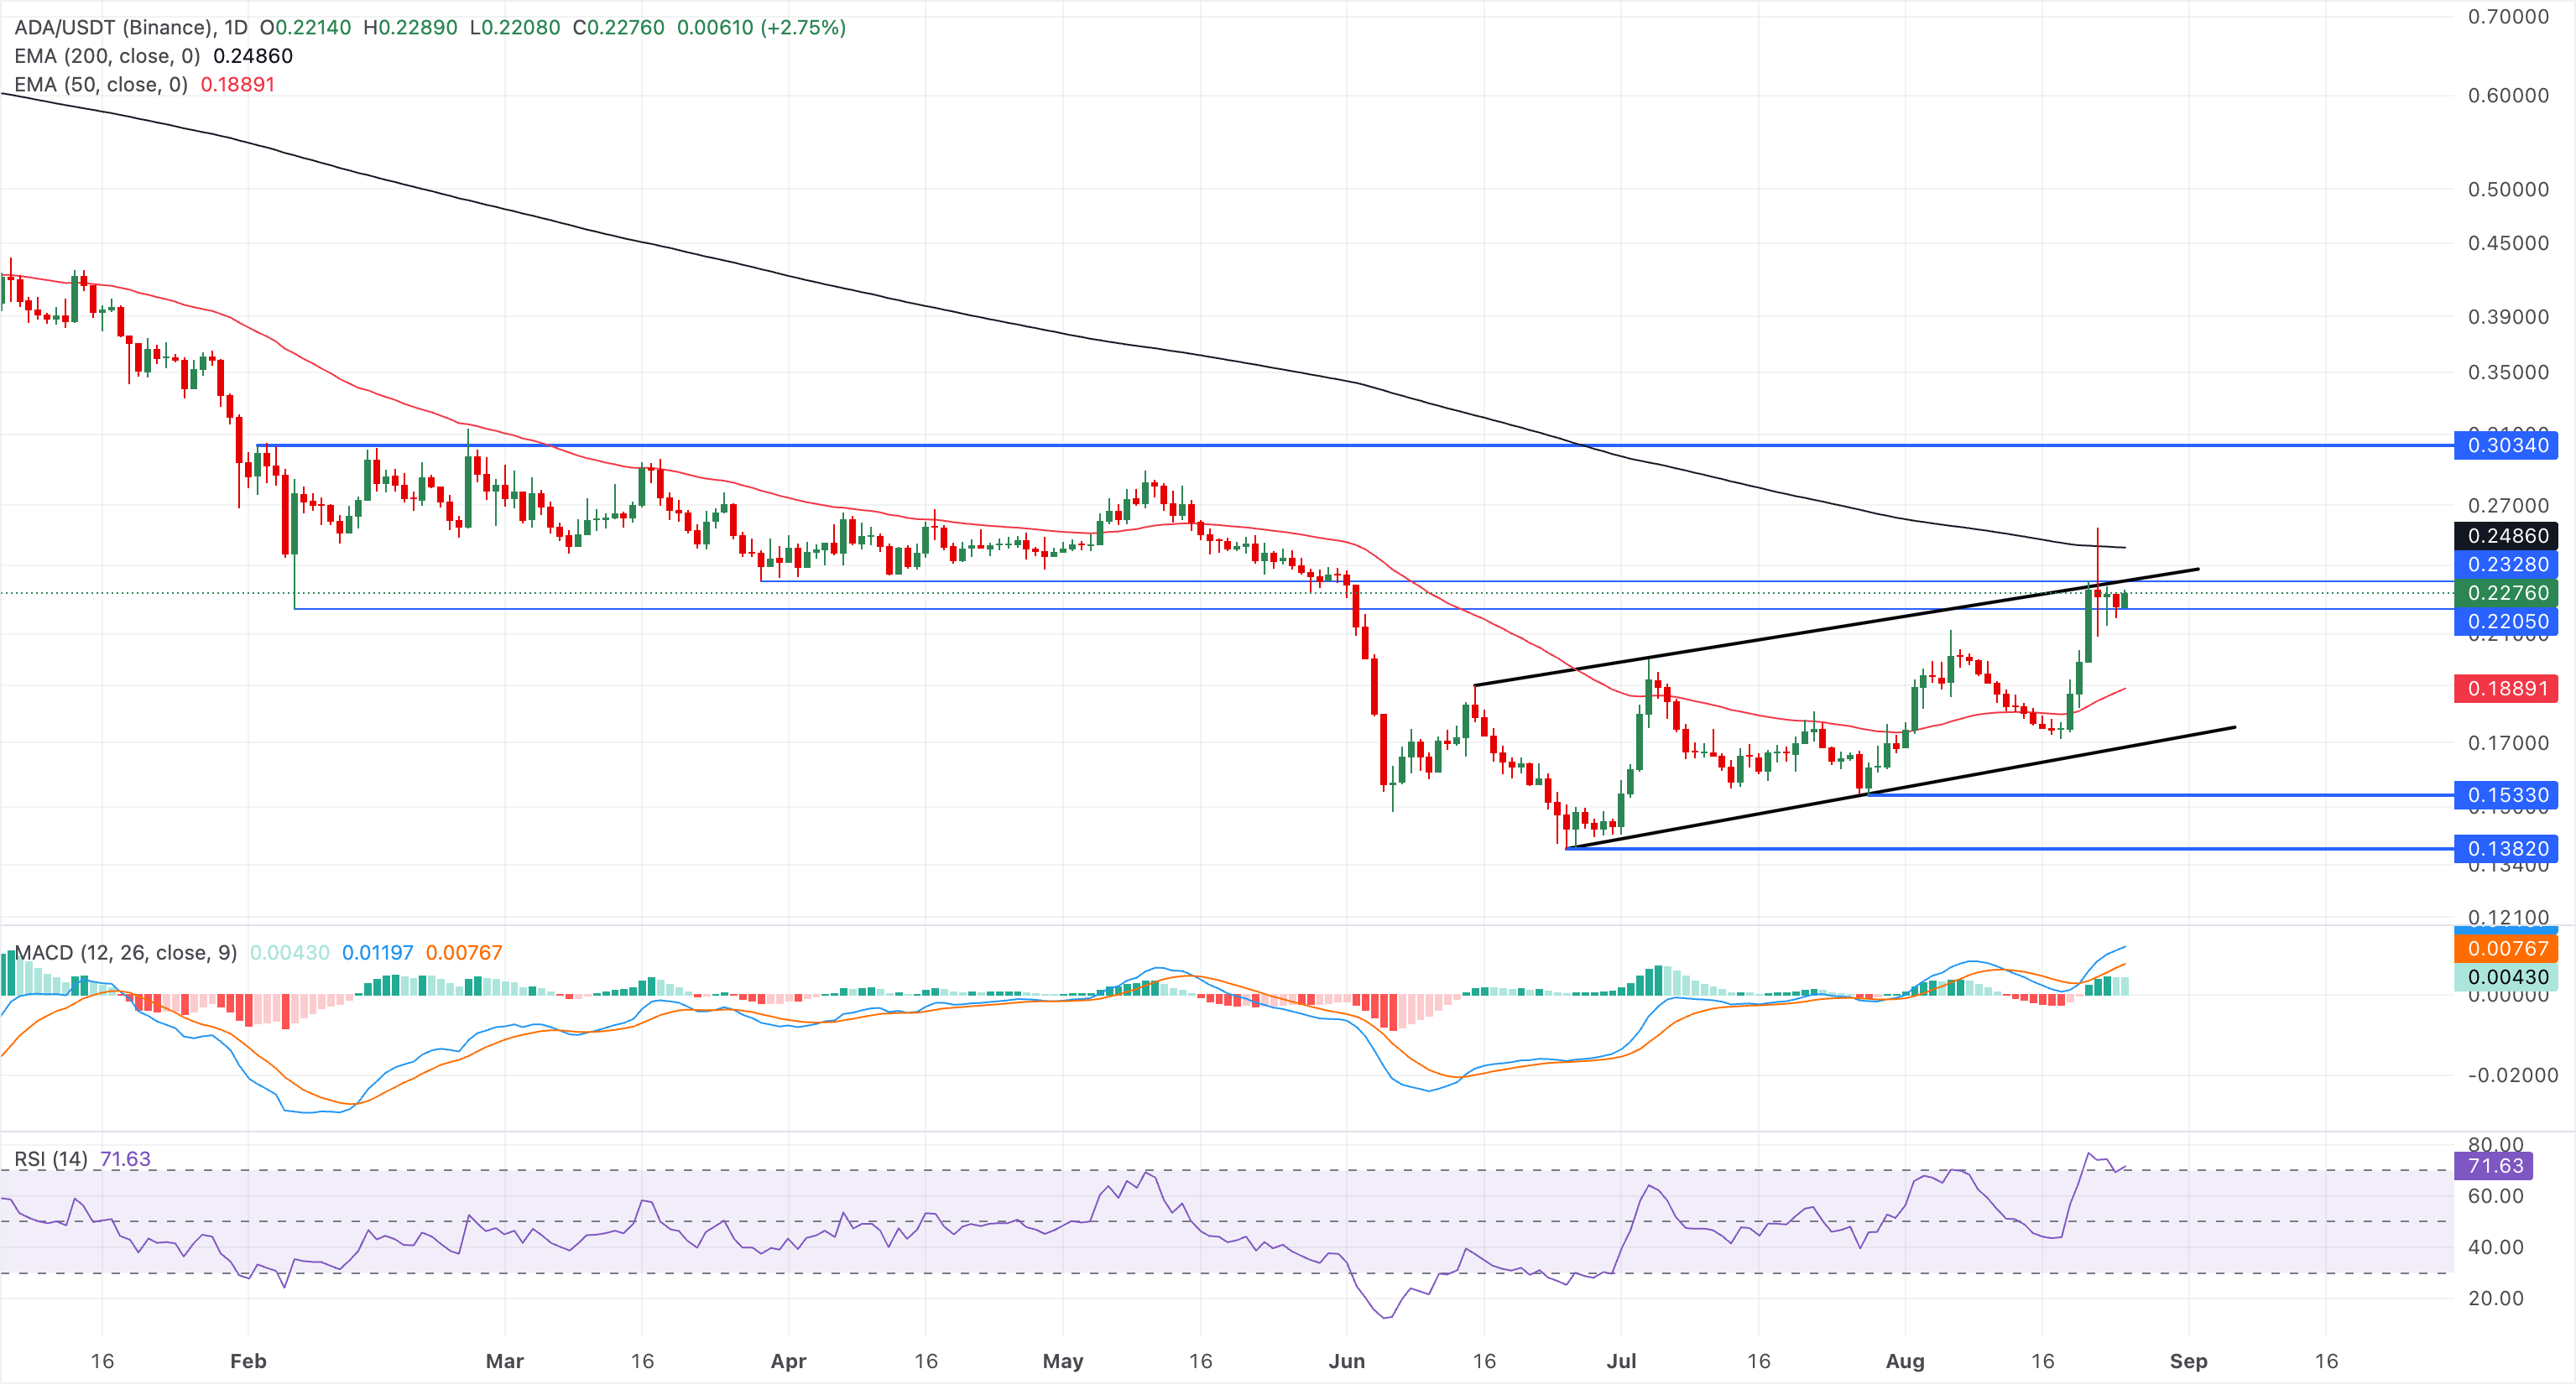
On the downside, immediate support is at the 50-day EMA around $0.1889, with the prior trendline-break area near $0.1751 serving as a deeper structural floor if a corrective pullback unfolds.
Solana reclaims $100 as SOL ETFs record $33 million in inflows
Solana is up over 2% on Tuesday, extending its 3% gain from the previous day. SOL maintains a constructive bullish bias, with its upward trend over the last nine days crossing the 50-day and 200-day EMAs at $80.12 and $89.44, respectively.
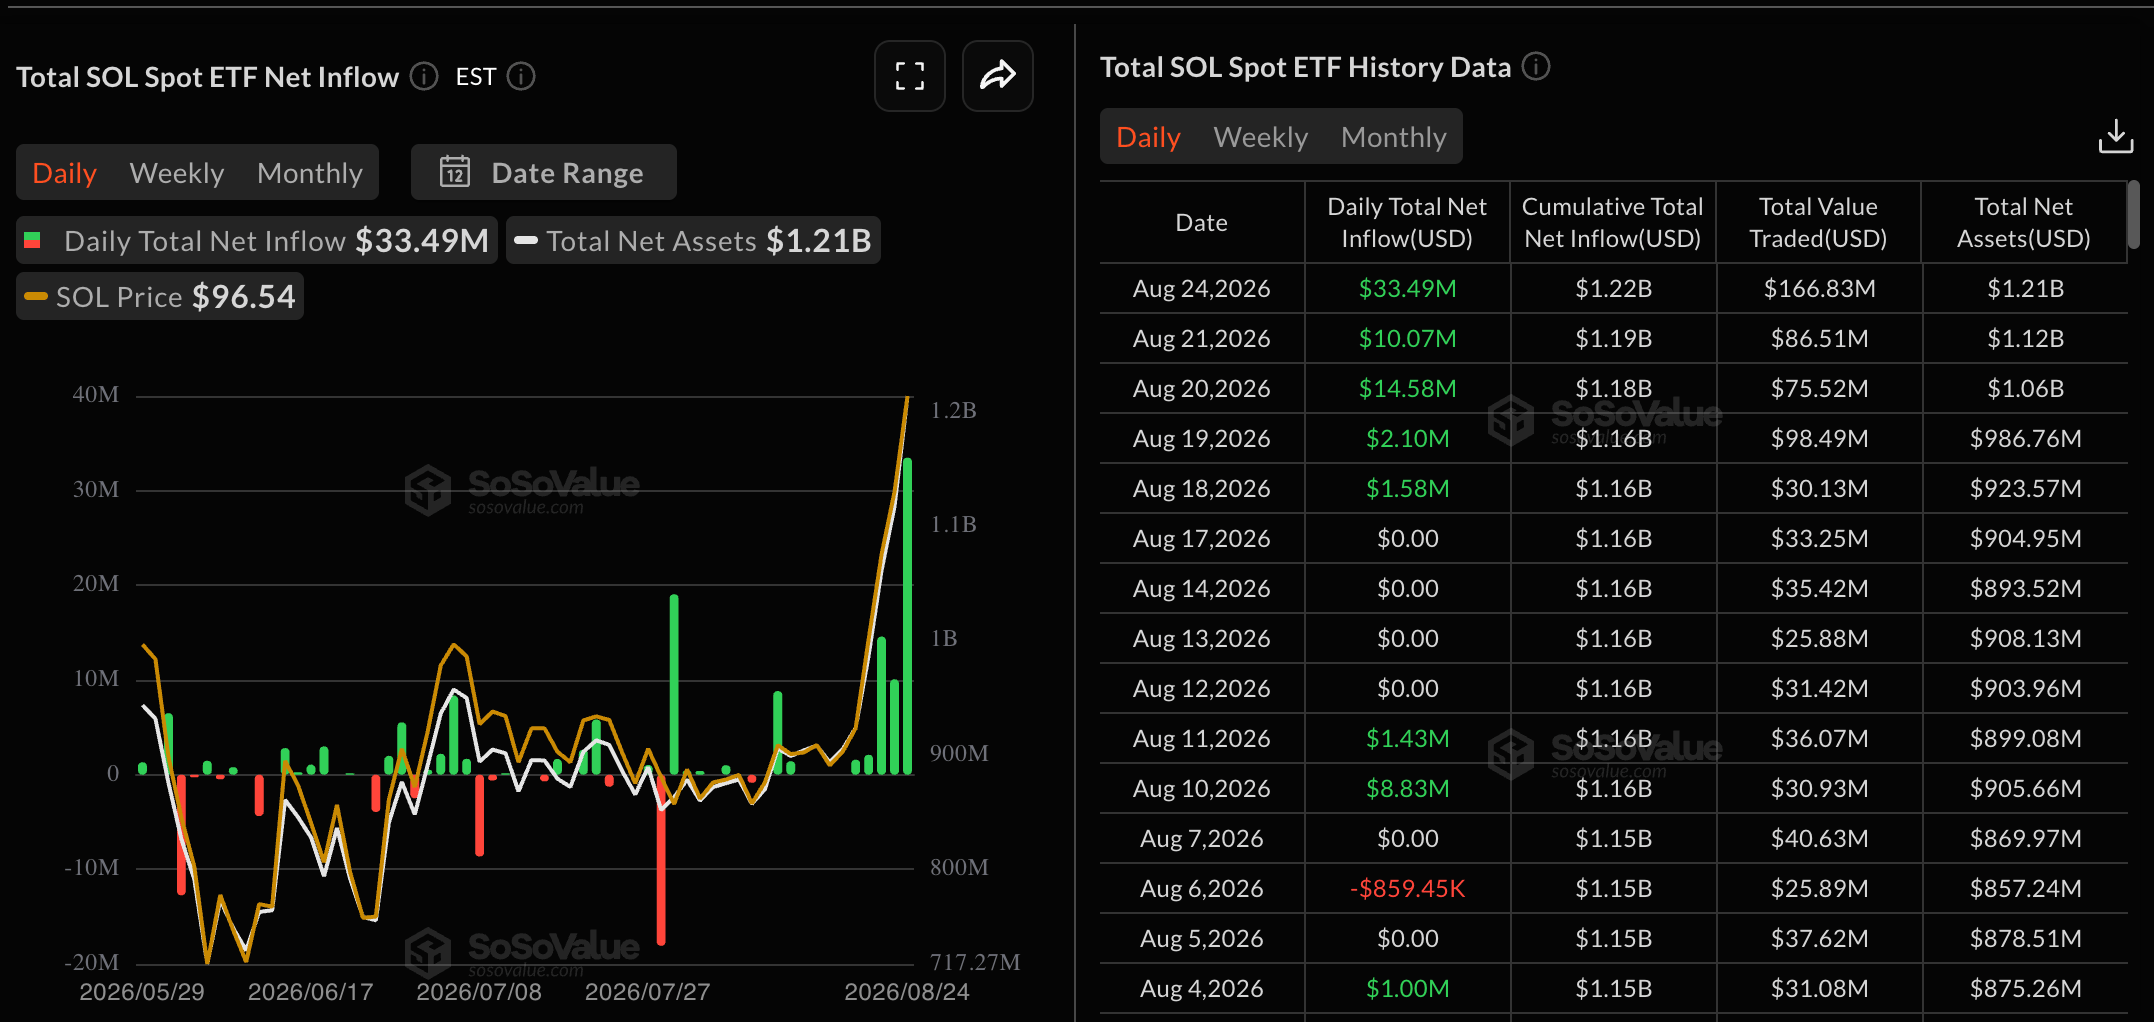
The steady recovery in Solana aligns with renewed institutional demand. SOL ETFs recorded five consecutive days of inflows, with $33.49 million on Monday, the highest daily inflow so far in 2026.
Momentum supports the recovery in Solana, with the RSI at 87, deep in the overbought zone, while the MACD and signal line extend a steady upward trend, with an expanding bullish histogram.
Looking up, the immediate resistance for Solana aligns with a December 18 low at $116, followed by the $150 psychological supply zone.
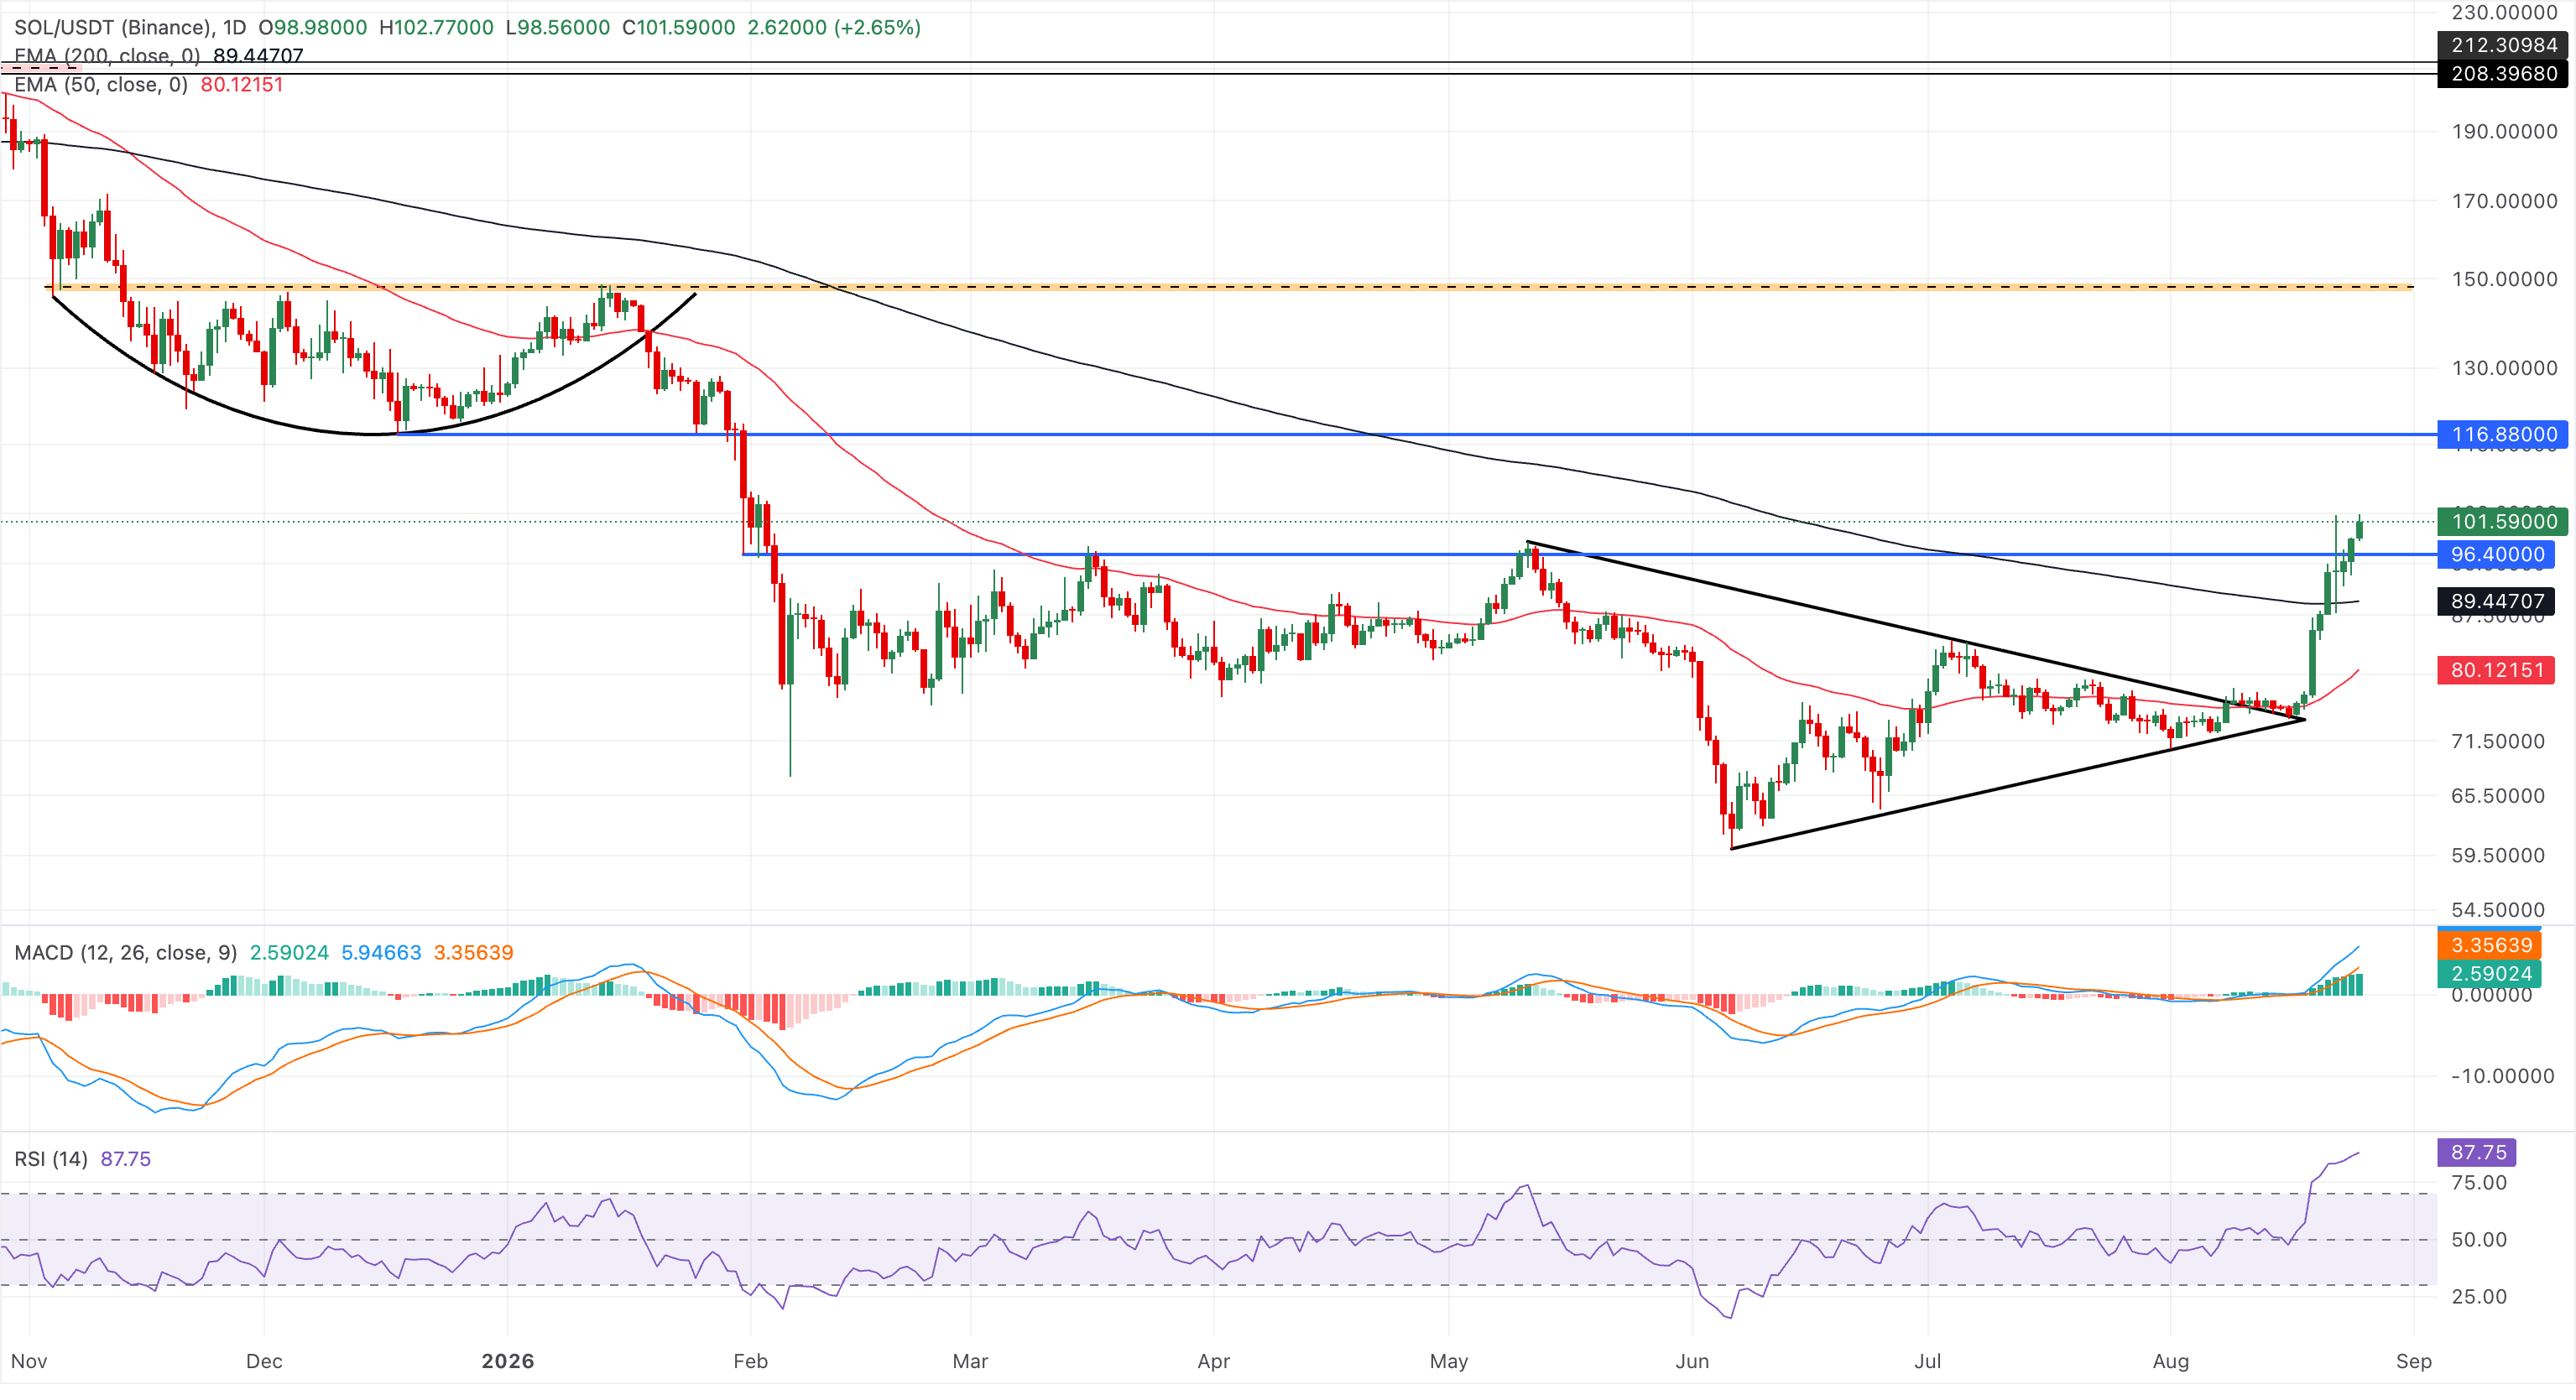
On the downside, immediate support is seen at the 200-day EMA at $89.44 and the 50-day EMA at $80.12.
(The technical analysis of this story was written with the help of an AI tool. Know more.)
Source link
Author

- Ytv Market News
- Share-market news writer and analyst with deep experience covering equities, commodities, forex, and cryptocurrencies for readers in the USA, UK, Canada, and Australia. Ytv Market News delivers timely market updates, practical trading insights, and clear explanations of macro and company-level catalysts that move prices. Combines on-the-ground financial reporting with technical analysis, using concise charts and actionable ideas to help investors and traders make smarter decisions.
Latest entries
 Investing InsightsAugust 25, 2026Mexico GDP Grows 1.4% in Q2 Quarter-on-Quarter; Recovery Underway but Inflation Reacceleration Fuels Rate Hike Expectations — BigGo Finance
 GermanyAugust 25, 2026Shares drift ahead of Nvidia earnings; oil wobbles
 CanadaAugust 25, 2026The money conversation most roommates never have, until it’s too late
 AustraliaAugust 25, 2026Cedar Woods Properties Posts Record FY26 Profit as Presales Support Further Growth


