


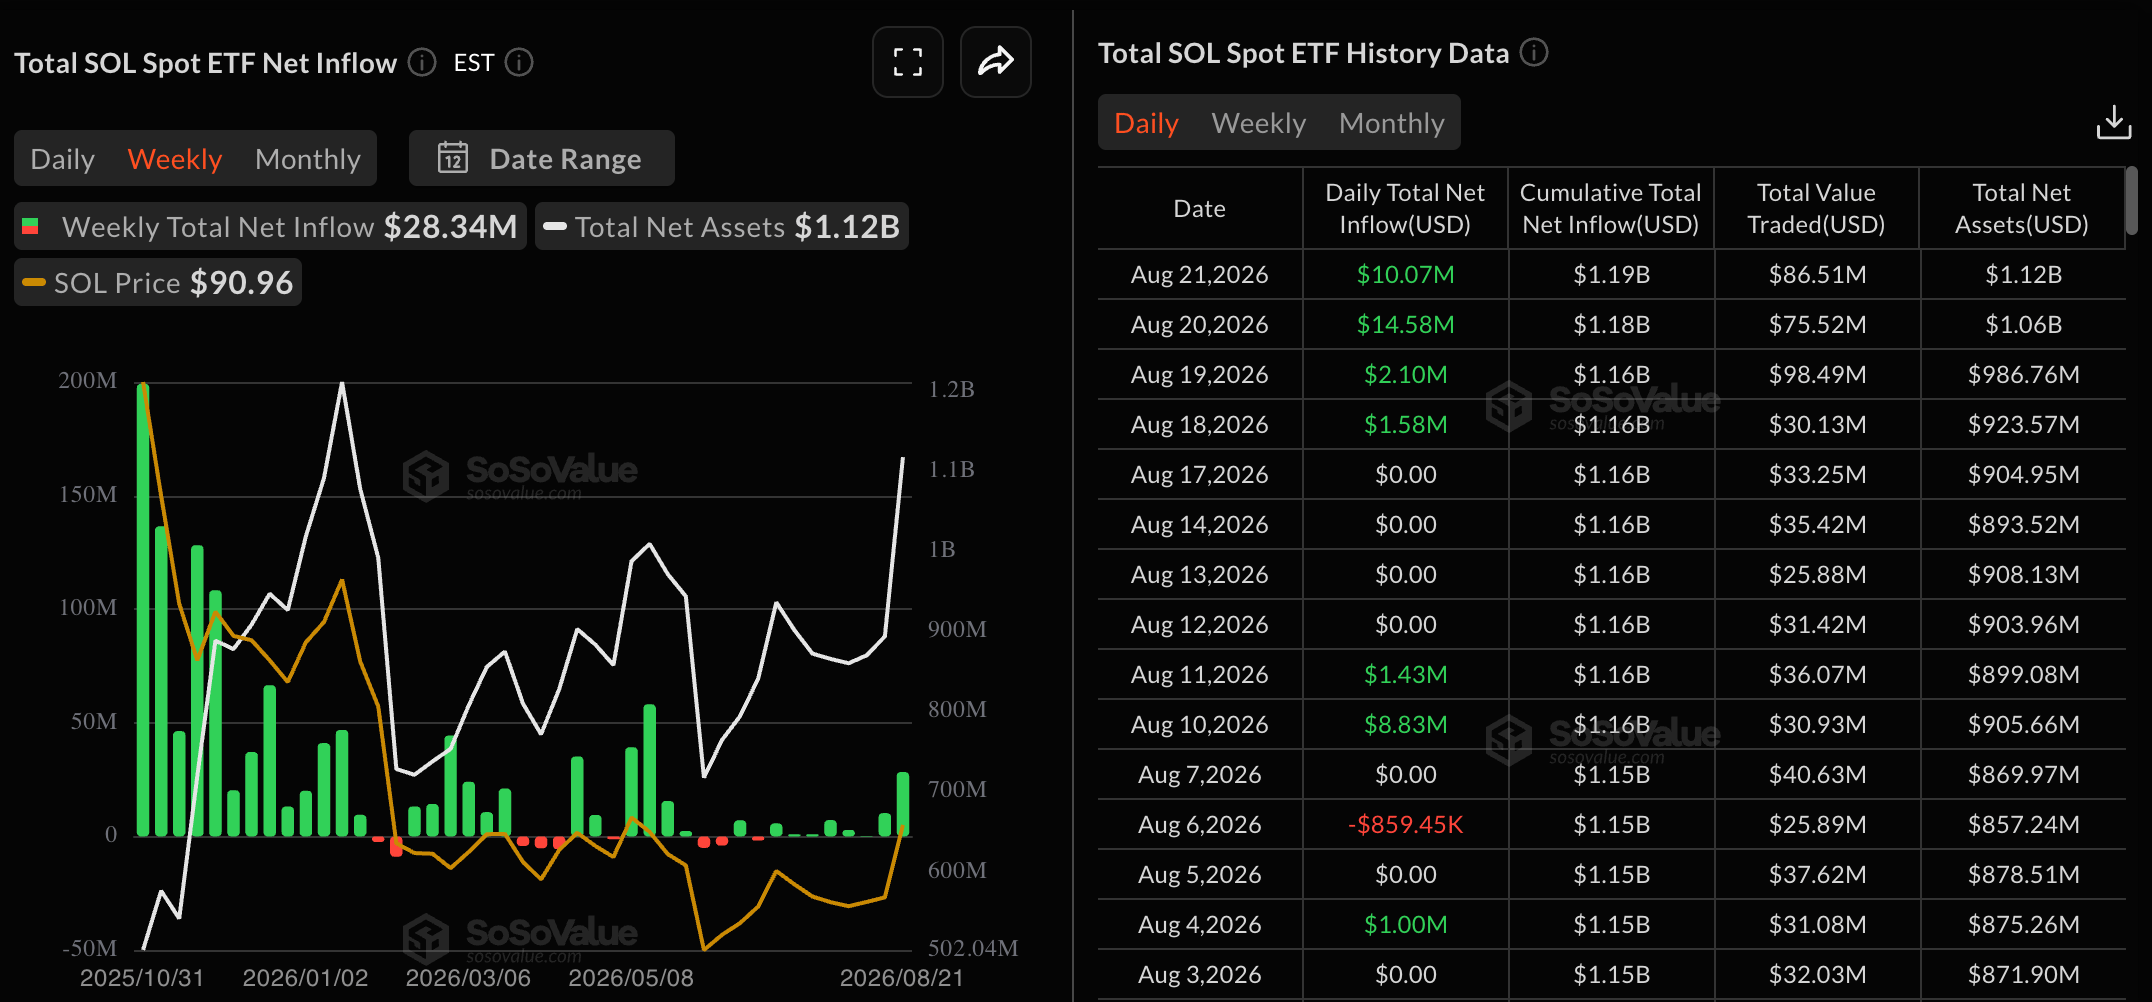
Solana (SOL) edges lower to $94 on Monday, following a 27% rebound last week to a two-month high. SOL-focused Exchange Traded Funds (ETFs) recorded four consecutive days of inflows last week, totaling $28.34 million, suggesting renewed institutional buying. Validator voting on multiple proposals started on Monday, which includes doubling the disinflation rate to 30%.
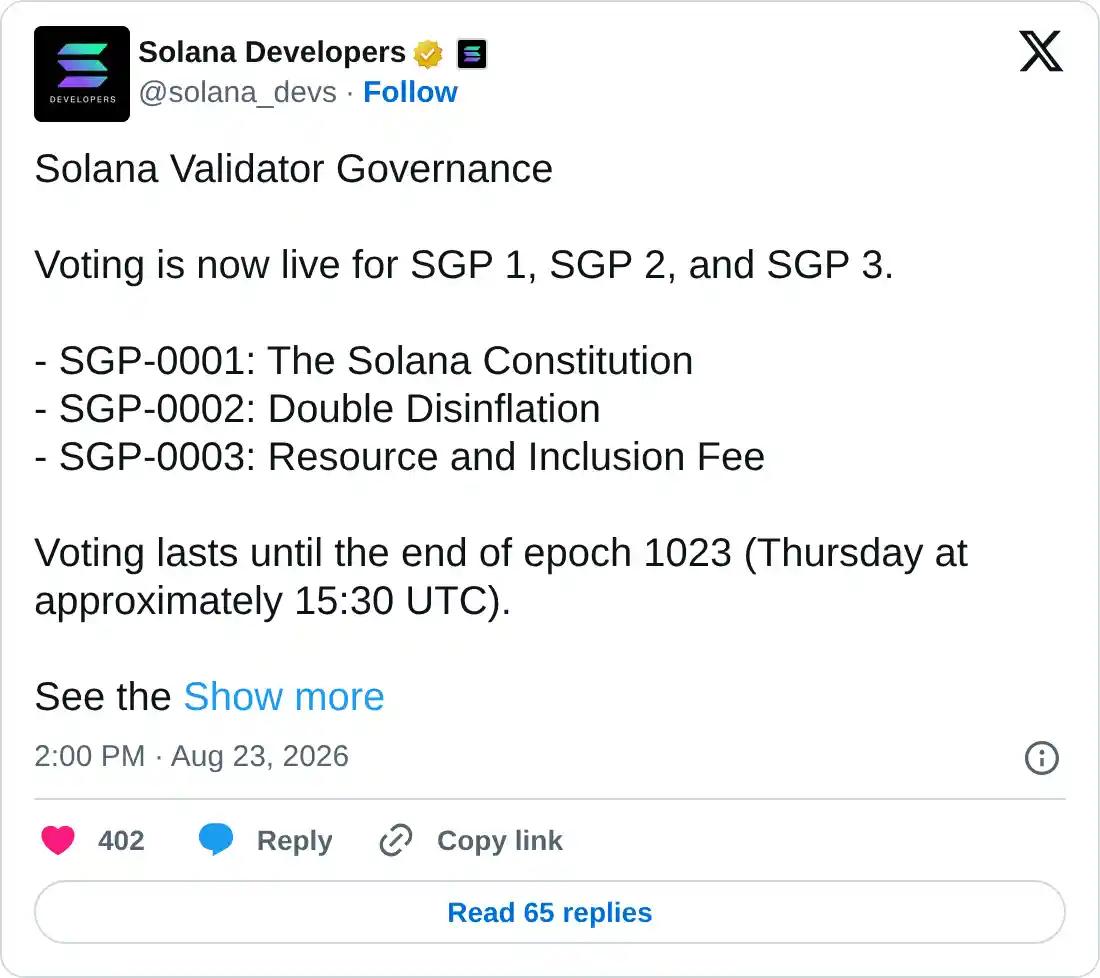
Solana validator voting begins
Solana validators have begun voting on SGP 1, SGP 2, and SGP 3 proposals, with voting ending Thursday. The SGP 1 protocol addresses the ratification of the Solana Constitution to govern Solana’s network-level decision-making. SGP 2 proposes reducing the inflation rate by increasing the disinflation rate to -15% to -30%. Finally, SGP 3 plans to introduce a fixed base inclusion fee paid to the block leader and a resource fee with a requested transaction cost, which will be burned.
Taken together, the proposals will restructure on-chain decision-making and reduce pressure on available supply.
Solana ETFs regain strength
Solana regains institutional demand. SoSoValue data shows the SOL-focused ETFs recorded $28.34 million in inflows last week, the highest over the last two months. Typically, renewed buying from institutional investors implies a bullish trend reversal.
Technical outlook: Will SOL price cross above $100?
Solana trades around $94 on Monday, holding a bullish near-term bias above both the 50-day Exponential Moving Average (EMA) at $79.04 and the 200-day EMA at $92.67. SOL price remains capped below the $100 psychological level and the May 11 high of $98.41.
For a sustained recovery, SOL should confirm a decisive close above the $100 mark. This could open the path toward the 127.2% Fibonacci extension level of the $98.41 to $60.13 downswing at $112.52.
Momentum stays strong, with the Relative Strength Index (RSI) hovering in overbought territory near 79 on the daily chart. At the same time, the Moving Average Convergence Divergence (MACD) shows a steady upward trend with a positive histogram, suggesting that buying pressure remains dominant.
On the downside, initial support is seen at the 200-day EMA around $92.67, followed by the 78.6% retracement near $88.56. Deeper declines would expose the 50-day EMA at $79.04 and the 50% retracement at $76.92.
(The technical analysis of this story was written with the help of an AI tool. Know more.)
Source link
Author

- Ytv Market News
- Share-market news writer and analyst with deep experience covering equities, commodities, forex, and cryptocurrencies for readers in the USA, UK, Canada, and Australia. Ytv Market News delivers timely market updates, practical trading insights, and clear explanations of macro and company-level catalysts that move prices. Combines on-the-ground financial reporting with technical analysis, using concise charts and actionable ideas to help investors and traders make smarter decisions.
Latest entries
 Investing InsightsAugust 24, 2026Lee Eok-won: “Relocation Loan LTV to Be Based on Cooperative Member Sale Price” — BigGo Finance
 GermanyAugust 24, 2026Germany’s Uniper says it has filled 70% of its contracted gas storage
 Crypto NewsAugust 24, 2026Bitcoin Hits $71,992 As Historic Short Squeeze Shakes Crypto
 Crypto NewsAugust 24, 2026Pi Network holds key support amid Testnet’s upgrade to Protocol 27


