

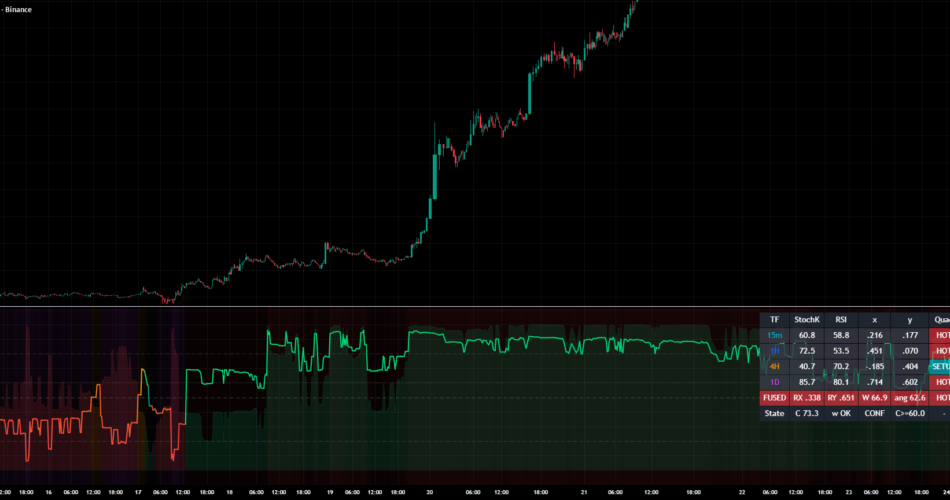
WHAT IT COMPUTES
Each of four timeframes (15m, 1H, 4H, 1D by default) contributes two readings. Stochastic %K says where price sits inside its recent range; RSI says how one-sided the recent moves have been. They become the two axes of a plane – x is (%K – 50)/50, y is (RSI – 50)/50 – so each timeframe is one point on it. Both oscillators are computed inside their own timeframe on that timeframe’s own bars, and by default the value used is the previous closed higher-timeframe bar, so nothing repaints.
Each point is then normalised to unit length. Only its direction survives; how far from the centre a timeframe sits is thrown away. The four unit vectors are averaged with the fusion weights – 0.10, 0.20, 0.40, 0.30 by default, normalised onto a simplex – into one resultant. The coloured line is 50 plus 50 times that resultant’s x component. The filled area under it is the resultant’s length on a 0 to 100 scale, and that is what the script calls coherence. The background names the quadrant the resultant occupies, and the table prints both raw sensors, both axes and the quadrant for every timeframe plus the fused row.
THE PLANE IS A DIAGONAL
Stochastic %K and RSI on the same series are close to the same measurement. Over 5,985 scored bars of 15m data from 2026-06-22 to 2026-08-23 they correlate 0.745 to 0.801 inside every one of the four timeframes, on all three instruments tested, and they sit on the same side of 50 on 80.6% to 88.8% of bars.
So the two-axis plane is mostly one axis with scatter around it, and the quadrant map is really two states. The off-diagonal quadrants – HOLLOW (%K high, RSI low) and SETUP (%K low, RSI high) – are occupied on 13.6% of bars on BINANCE:BTCUSDT, 13.3% on ETHUSDT and 18.7% on SOLUSDT. Two genuinely independent axes would put that number near 50% by symmetry, before any simulation.
The leg counts say the same thing from the other side. When the fused vector sits in HOT or SOLD, an average of 2.6 to 2.9 of the four timeframes are in that same quadrant. Off-diagonal, the average is 0.8 to 1.2 of four: the fused vector lands there because the legs cancel, not because any of them points there.
COHERENCE IS LOWER THAN ON A RESHUFFLED COPY OF THE SAME PRICE
Coherence is the length of a weighted mean of four unit vectors. As a statistic it starts high: four independent, uniformly random directions under the default weights give a median of 49.6, clear 60 on 34.5% of draws and clear 87 on 5.1% (eight independent runs of 500,000 draws). That is a property of the scale rather than a null – this indicator cannot produce independent directions, because its four legs are nested aggregations of one price path.
The null that keeps the construction and destroys only the market is to resample the real 15m bars, each keeping its own open-high-low-close geometry, chain them onto a running price, and re-aggregate them into 1H, 4H and 1D exactly as the exchange would. The nesting survives; the order of the market’s moves does not. Real data comes out BELOW that null, on every instrument and under both an i.i.d. resample and a one-day block bootstrap (60 draws each). The real figures here differ slightly from the ones above because every draw, and the real series with it, is rebuilt from the same 62 days of 15m bars so that the daily leg warms up on identical history – which leaves 4,575 scored bars rather than 5,985:
mean coherence BTCUSDT 59.84 vs 63.28 / 62.51 ETHUSDT 57.36 vs 63.66 / 63.60 SOLUSDT 54.72 vs 62.70 / 62.14
share above 87 BTCUSDT 23.23 vs 29.18 / 27.28 ETHUSDT 24.24 vs 29.88 / 28.90 SOLUSDT 20.32 vs 28.91 / 26.17
There is no alignment excess to report. A weaker null – rotating the four legs against each other in time – does put real coherence above chance at p = 0.002 to 0.006, and that is the test a description would normally quote. It should not be quoted: a synthetic driftless random walk passes the same test by 5.1 to 7.4 coherence points at p = 0.010 to 0.055. That null destroys the nesting, which is a property of the indicator, not of the market.
THE DEFAULT THRESHOLD IS NOT A FILTER
At 60, the gate passes 44.3% of bars on BTCUSDT, 45.8% on ETHUSDT and 43.4% on SOLUSDT, against 34.5% for four random directions. It is a coin flip sitting about ten points of chance-rate above the floor.
There is also a way to switch it off by accident. Because the other legs can cancel at most one minus the largest normalised weight, coherence has a hard floor of max(0, 2·wmax – 1) × 100. At the defaults the largest weight is 0.40 and the floor is zero. Raise one weight past half the total and the floor rises with it: a position weight of 5 against the other defaults pins coherence at 75.4 or above on every bar, and a single-timeframe configuration pins it at exactly 100. The gate then passes everything, silently. That is in the weights tooltip now.
THE ALERT’S TWO GATES FIGHT EACH OTHER
The one alert that survives here marks a quadrant shift while coherence is above the threshold. The two conditions are close to opposites by construction: coherence is high when the fused vector is holding still, and a quadrant change is what happens when it is not.
Measured, a quadrant-change bar carries a median coherence of 36.6 on BTCUSDT against 54.1 for bars in general. Only 8.1% of the 172 quadrant changes clear 60, against 44.3% of all bars – five times less likely. ETHUSDT gives 5.7% of 315 changes against 45.8%, eight times less likely; SOLUSDT 7.7% of 313 against 43.4%. That is why the alert fires just 14, 18 and 24 times over 62 days. Rare, yes – but rare because the gates disagree, not because something unusual is being caught.
NO STATE CARRIES FORWARD INFORMATION, AND HERE IS WHAT THAT IS WORTH
Testing all eleven states this script draws – both coherence thresholds, the low-coherence state, all four quadrants, quadrant shifts with and without the coherence gate, and both extremes of the wave – at horizons of 4, 16 and 96 bars, in both signed and absolute return, counted as episodes rather than as overlapping bars, against 500 shared circular shifts of the forward-return series: the largest standardised effect anywhere in the family of 66 tests is 2.91 on BTCUSDT, against a family whose own median maximum on a shifted copy is 2.49. The family-wise p is 0.269. ETHUSDT gives 2.17 against 2.51 (p = 0.735) and SOLUSDT 2.30 against 2.49 (p = 0.659).
A negative result is only as good as its power, so: 62 days of 15m bars hold 1,496 non-overlapping one-hour windows, 374 four-hour windows and 62 daily ones. For a state occupying a quarter of them, the smallest mean difference this window could detect at 80% power is 0.066% at one hour, 0.271% at four hours and 1.694% at one day. The one-hour and four-hour results are therefore real tests. The daily one is not: nothing short of an enormous daily edge could have shown up in 62 windows, and the absence of one there means very little.
One member of that family is worth naming, because anyone who tests it on its own will find it. The gated quadrant shift on BTCUSDT is followed by a lower four-hour return than the rest of the sample: 12 of its 14 events are negative, mean -0.569% against an unconditional +0.053%, which taken alone clears p = 0.01. It does not survive contact with anything. It is the maximum of the 66-member family above, whose family-wise p is 0.269. Dropping the single worst event moves the mean to -0.325% and dropping two moves it to -0.188%; the median is -0.252%, not -0.569%. And it does not replicate: ETHUSDT gives 9 of 18 positive with a median of +0.012%, and SOLUSDT 10 of 24 positive with the mean turning positive once two events are dropped. Fourteen events is not a sample.
WHAT CHANGED IN THIS VERSION
A setup-zone alert asked for the SETUP quadrant AND coherence above the threshold at once. Over 5,985 bars it would have fired zero times on BTCUSDT, three on ETHUSDT and four on SOLUSDT. It was not a rare signal, it was the sharpest form of the contradiction above – SETUP is where the legs cancel and coherence measures whether they cancel – so it is gone rather than given a lower threshold that would hide the reason. The remaining alert says in its own text that it describes geometry rather than predicting anything.
The coherence area was declared after the wave, so it was painted over it: the fill sat above the line on 48.2% of bars on BTCUSDT and by more than 10 points on 25.9%, and because the fill’s opacity ramps up with coherence, the wave’s hue – its only encoding of the regime angle – was washed out hardest on exactly the bars the indicator asks you to trust most. The area is now declared first and takes the wave’s own colour, since it is the magnitude of the same vector whose angle sets that colour, and the quadrant shading behind both is a wash rather than a block. The coherence threshold is now drawn as a dotted line so the level the alert uses is visible on the pane.
An MPL header was added, a leftover compile-sentinel plot removed, and the header and three inputs now carry the measurements above in their tooltips. No computation changed: every plotted number is identical to the previous version.
WHAT ACTUALLY MOVES THE OUTPUT
The four fusion weights, by a wide margin. Measured on BTCUSDT 15m against the defaults over 5,700 bars after warm-up, equal weights move the wave by a median of 6.7 points, a short-term-heavy setting by 23.2, and collapsing onto a single timeframe by 28 to 33 with a maximum near 89.
The two sensors are not equal partners. Over a 9-to-21 band the Stochastic %K length moves the wave by a median of up to 4.1 points and a 90th percentile of up to 28.8; the RSI length over the same band moves it by a median of up to 1.3 and a 90th percentile of 3.1. That is a factor of three at the median and nine in the tail. For all the two-sensor framing, this is a Stochastic wave with an RSI trim.
The coherence threshold and both display toggles move the plotted series by exactly zero; the threshold only gates the alert and the dotted line that marks it.
WHAT THE MEASUREMENTS COVER
All of it is 15m data from 2026-06-22 to 2026-08-23, 62 days, on three instruments, in a window where BTCUSDT rose 20.2%, ETHUSDT 39.5% and SOLUSDT 28.4%. Nothing was tested outside that window, in a falling market, or on a non-crypto instrument. Everything is measured on the configuration that was cross-checked: a 15m chart with the default Confirmed-only data mode, where the four requested timeframes are the chart’s own and three above it. On a 1H or higher chart the 15m leg becomes a lower-timeframe request and resolves differently. The Developing HTF mode was not measured, because the reimplementation does not model a partially formed higher-timeframe bar faithfully enough to quote – it is the one setting here that lets the displayed value change after the bar it belongs to has opened, and it should be treated as repainting until someone measures it. No figure here covers either case.
HOW THE NUMBERS WERE CHECKED
The whole computation was reimplemented outside Pine and cross-checked against this chart’s Data Window: sixteen quantities on ten bars – both plotted series, both raw sensors for all four timeframes, the resultant’s two components, its length, its angle, the fused quadrant and the shift flag – with two of the ten bars carrying a quadrant shift so the event path was exercised rather than assumed. All 160 values round to the exact four decimals TradingView prints, with a worst raw difference of 5.0e-5, the display’s own rounding floor.
Open source under MPL 2.0. Nothing here is a forecast, a signal service, or a claim of profitability.
Source link
Author

- Ytv Market News
- Share-market news writer and analyst with deep experience covering equities, commodities, forex, and cryptocurrencies for readers in the USA, UK, Canada, and Australia. Ytv Market News delivers timely market updates, practical trading insights, and clear explanations of macro and company-level catalysts that move prices. Combines on-the-ground financial reporting with technical analysis, using concise charts and actionable ideas to help investors and traders make smarter decisions.
Latest entries
 Crypto NewsAugust 24, 2026Bitcoin Breakout Meets Skepticism Across Prediction Markets
 Crypto NewsAugust 24, 2026Cardano Price Forecast: ADA rally pauses as profit taking kicks in
 CanadaAugust 24, 2026Canadian Investment Regulatory Organization Trading Halt
 Trading IndicatorsAugust 24, 2026TWAP/VWAP/POV Execution | Trading Indicator


