

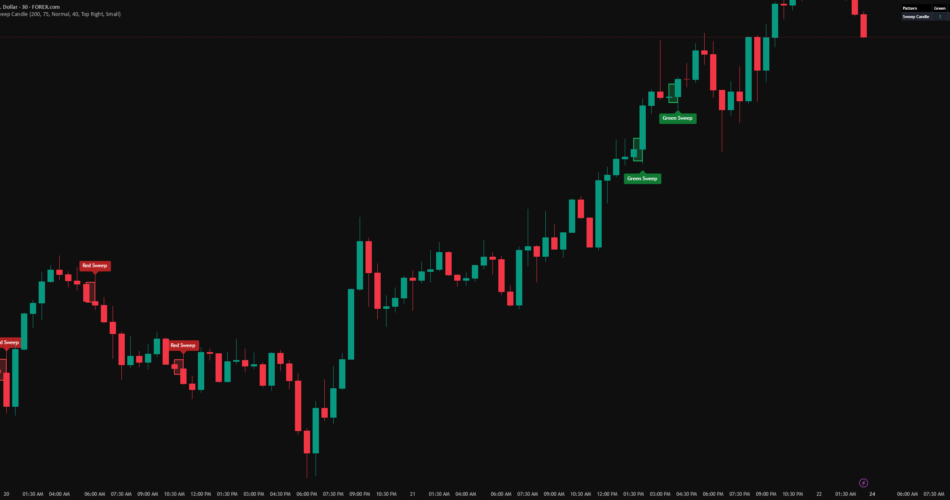
A two candle pattern where one candle takes the stops on one side of the market and then closes
through the other.
Both candles are the same colour. The second one first trades BEYOND the far side of the first,
taking out the orders resting there, and only then CLOSES past the opposite side. By the time it
finishes it has covered the first candle’s entire range, and it has done so in the direction it
was already moving.
The script scans closed candles for that sequence and draws the range it happened in.
THE TWO PATTERNS
A candle is Green when close is greater than open, and Red when close is less than open. A Doji,
where close equals open, is neither and takes no part. Only fully closed candles are read; the
candle still forming is never used.
Green Sweep Candle
Candle 1 is Green
Candle 2 is Green
Candle 2 LOW is at or below Candle 1 LOW the sweep
Candle 2 CLOSES above Candle 1 HIGH the close beyond
Red Sweep Candle
Candle 1 is Red
Candle 2 is Red
Candle 2 HIGH is at or above Candle 1 HIGH the sweep
Candle 2 CLOSES below Candle 1 LOW the close beyond
That is the whole definition. Two rules, and both have to be true on the same pair.
WHAT MAKES THIS DIFFERENT
1. The order matters, not just the shape.
Plenty of candles end up covering the one before them. What is being looked for here is a
sequence: price first goes the WRONG way far enough to clear the previous candle’s extreme, and only after that commits the other way. A candle that simply opens beyond the previous range and runs is not the same event, and it is not reported.
2. The close decides, not the wick.
Reaching past the opposite side is not enough. The candle has to CLOSE beyond it. A long wick
that pokes through and pulls back means the move was rejected, so it does not count. This single rule removes most of what a shape based check would report.
3. Both candles must share a colour.
This is what separates the pattern from an ordinary large candle. The first candle already
committed to a direction. The second one dips against it, clears the level, and then closes even
further in the SAME direction. Sellers into a Green pair and buyers into a Red pair were taken
out, and the original direction carried on regardless.
4. It is deliberately rare.
A sweep on its own is common. A candle covering the previous one is common. Both of them together, in the same colour, with a close settling beyond, is not. Long stretches with nothing on the chart are normal and expected.
READING THE CHART
Each detected pattern draws a rectangle over Candle 1’s full High to Low range, stretched from
Candle 1 across to Candle 2. That box is the range that was swept and then closed through.
Green Sweep drawn in the bullish colour, label sits below the box
Red Sweep drawn in the bearish colour, label sits above the box
The label points at its own box, so it is always clear which rectangle it belongs to.
A summary table in the corner counts how many of each type were found inside the current scan window. It counts every pattern found, including a type that is currently switched off, so the table always reflects what the market actually printed rather than what is on screen.
SETTINGS
Scan
– Scan Length: how many closed candles are scanned backwards from the latest bar. The running candle is always excluded.
Pattern Types
– A switch for Green Sweep Candle and one for Red Sweep Candle.
Zone Style
– Bullish Zone and Bearish Zone colours, and the fill transparency of the box.
Labels
– Show Labels, Label Size, and Label Distance from Zone as a percentage of the candle’s height.
Increase the distance on noisy charts so labels clear the candles.
Summary Table
– Show, position and size of the corner table.
ALERTS
Two alert conditions: Green Sweep Candle and Red Sweep Candle.
Each message carries the pattern name, the symbol, the timeframe and the closing price. The same messages are also sent through the alert function, so the “Any alert() function call” alert type can deliver both through a single alert.
All alerts are evaluated only after a candle has fully closed.
REPAINTING
This script does not repaint.
– Detection reads confirmed candles only. The scan starts one bar behind the latest bar, so the
candle that is still forming is never part of any calculation.
– Every alert signal is written so that it can only become true once a candle has finished. Price
moving inside an open candle cannot make a signal appear and then disappear.
– Boxes are rebuilt on the last bar using confirmed history. A box that has been drawn does not
move or change afterwards. It only leaves the chart when it falls outside the Scan Length
window.
When you create an alert, TradingView may show a caution banner saying the indicator can repaint.That banner appears automatically for any script that uses the built in bar state variables, no matter how they are used, because the platform cannot check the intent behind them. This script uses them for the opposite purpose: one of them is what restricts every signal to bar close, and the other is what redraws the boxes efficiently on the final bar. Choosing “Once Per Bar Close” when creating the alert is still recommended.
NOTES AND LIMITATIONS
– The pattern is rare by design. Two conditions have to line up on the same pair of candles, so
an empty chart is normal. If you want to see more of them, look at a faster timeframe rather
than loosening anything.
– Increasing Scan Length raises the number of drawing objects. TradingView caps these at 500
boxes and 500 labels, and the oldest are dropped once a cap is reached. The default is chosen
to stay well inside those limits on normal charts.
– Doji candles take no part. A pair containing one is never reported, because a Doji has no
direction to share.
– Detection is purely structural. It reports where the sequence occurred and nothing more. It
does not rank patterns by quality, measure follow through, or produce entries, targets or
stops.
HOW TO USE IT
The box marks a range that was swept and then closed through. Traders commonly watch these areas
for:
– Continuation, since the move carried on after the opposing orders had been cleared
– Reaction when price returns to the box later, the swept edge in particular
– Confirmation alongside higher timeframe structure, where a sweep in the direction of the larger trend carries more weight than one against it
The swept edge – the Low of a Green Sweep, the High of a Red Sweep – is the level price reached before turning, and it is usually the more interesting side of the box.
These are reference areas, not entry signals on their own. Use them alongside your own support
and resistance mapping, your own entry method and proper risk management.
DISCLAIMER
This indicator is a pattern detection tool. It is not financial advice and it makes no claim
about profitability. Trading involves risk. Always apply your own analysis and risk management.
Source link
Author

- Ytv Market News
- Share-market news writer and analyst with deep experience covering equities, commodities, forex, and cryptocurrencies for readers in the USA, UK, Canada, and Australia. Ytv Market News delivers timely market updates, practical trading insights, and clear explanations of macro and company-level catalysts that move prices. Combines on-the-ground financial reporting with technical analysis, using concise charts and actionable ideas to help investors and traders make smarter decisions.
Latest entries
 Politics News TodayAugust 24, 2026Trump’s New Jersey home could hold key to GOP, Dems midterm victory
 Market Movers TodayAugust 24, 20263 Market-Beating Stocks to Keep an Eye On
 IndiaAugust 24, 2026Hy-Tech Engineers IPO opens today: Price, dates, lot size and key details
 Company Press ReleasesAugust 24, 2026Net Asset Value(s) – Janus Henderson ICAV


